Trend Following Strategy By Industry (ETFs, 18% Annually Since 1926)
Few concepts are as enduring as momentum and trend following. A recent research paper titled “A Century of Profitable Industry Trends”, authored by Carlo Zarattini and Gary Antonacci, explores a systematic approach to capturing these trends over a 100-year horizon. We have chosen to call it a trend following strategy by industry.
The study demonstrates how a long-only, trend-following strategy applied at the industry level can significantly outperform a passive market investment while drastically reducing risk.
Related reading: –A trend following strategy for stocks
The Research Dataset: From 1926 to Today
The authors backtested their “Timing Industry” model using two primary sets of assets:
- 48 US Industry Portfolios: Utilizing daily total returns from July 1926 to March 2024, sourced from Kenneth French’s data library. These portfolios are rebalanced annually and weighted by market capitalization.
- 31 Sector ETFs: To demonstrate the strategy’s real-world tradability, the authors replicated the model using 31 State Street Global Advisors ETFs from January 2005 to March 2024, accounting for modern trading costs such as commissions and slippage.
The “Timing Industry” Trading Rules
The strategy is built on a disciplined, rules-based framework consisting of three main components: Entry, Sizing, and Exit.
Entry Criteria: Identifying the Trend
The model initiates a long position when an industry’s closing price exceeds the upper band of either of the following technical indicators:
- Donchian Channels: Based on the highest high of the last 20 days. The lower band uses 40 days to create a bias towards long exposure.
- Keltner Channels: Calculated using a 20-day Exponential Moving Average (EMA) plus a volatility-based offset (1.4 times the Average True Range). The lower band uses a 40-day lookback period.
The strategy is strictly long-only, meaning it only seeks to participate in upward trends and moves to cash (Treasury bills) when trends dissipate.
Sizing and Position Management: Volatility Targeting
To ensure no single industry dominates the portfolio’s risk, the authors utilize a Volatility Target approach:
- Each position is sized such that its contribution to portfolio volatility is equal.
- The weight of an industry is inversely proportional to its recent 14-day volatility.
- Leverage: The overall portfolio exposure is capped at 200% to meet practical leverage constraints.
Exit Criteria: Protecting Capital
A position is closed when the price crosses below a Trailing Stop, which is defined by the maximum of the lower bands of the Donchian and Keltner channels (using a 40-day lookback period). This trailing stop is never updated downward, ensuring profits are locked in and losses are cut quickly.
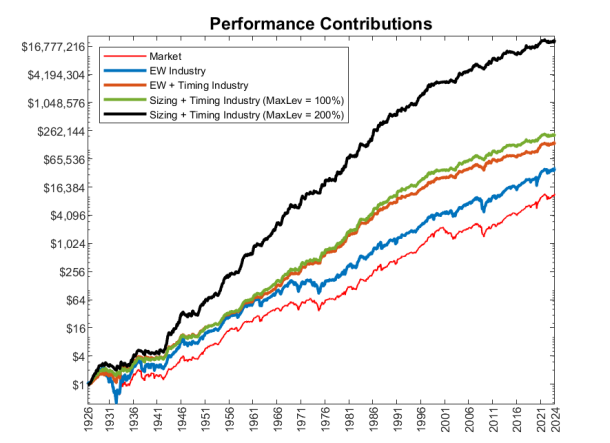
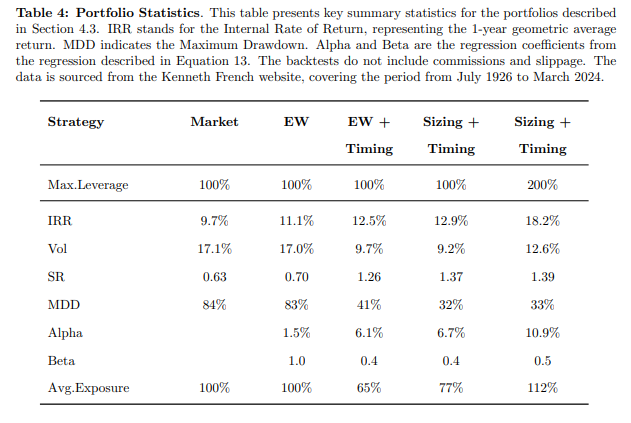
Key Results: Superior Risk-Adjusted Returns
The empirical evidence from the century-long backtest is compelling:
- Annualized Return: The trend following strategy by industry achieved 18.2%, compared to 9.7% for the passive US equity market.
- Sharpe Ratio: The model produced a Sharpe Ratio of 1.39, more than double the market’s 0.63.
- Drawdown Protection: The timing strategy reduced the maximum drawdown by nearly 60%, suffering a peak loss of only 33% while the market experienced a staggering 84% drop.
- Market Participation: The strategy shows a “convex” return profile, participating heavily in upswings (Upside Beta of 1.16) while significantly limiting exposure during downturns (Downside Beta of 0.31).
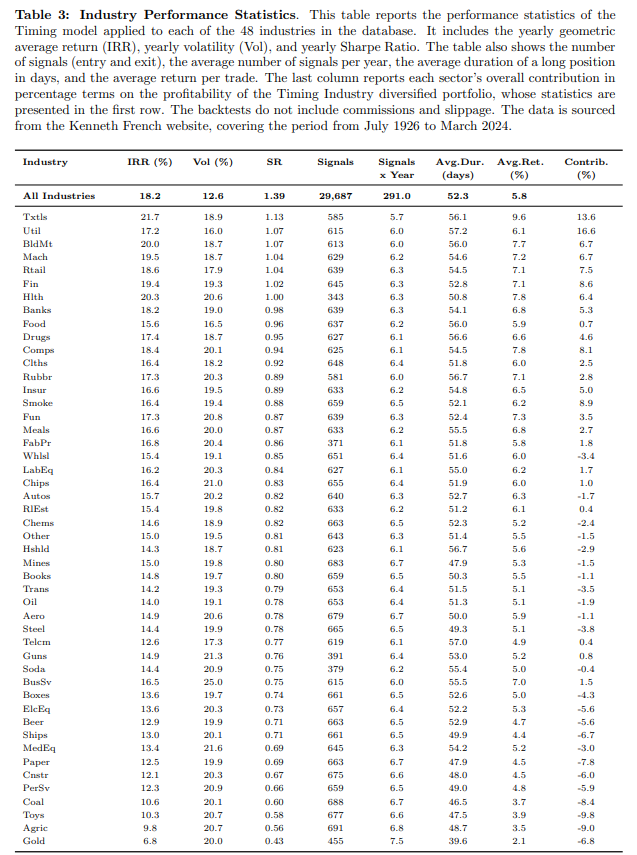
Also interesting is the number of trades and returns per industry:
Real-World Application: Replicating Success with Sector ETFs
In the final section of their paper, Zarattini and Antonacci transition from a theoretical 100-year backtest to a modern, tradable implementation using Exchange-Traded Funds (ETFs).
This replication, covering the period from January 2005 to March 2024, was designed to address concerns regarding the strategy’s efficacy in recent years and its viability when accounting for real-world trading frictions.
The ETF Dataset
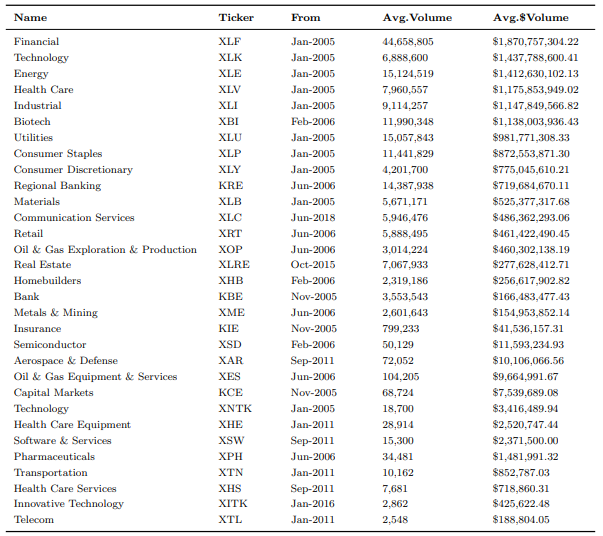
To prove the strategy’s practical utility, the authors utilized 31 sector-based ETFs provided by State Street Global Advisors,. This dataset covers a wide array of industries, including Financials (XLF), Technology (XLK), Biotech (XBI), and Real Estate (XLRE). While the original backtest used 48 industry portfolios, the 31 ETFs successfully replicated the model’s exposure and returns.
Here is a complete list of the ETFs they used:
A critical addition in this section is the inclusion of commissions and slippage. The authors applied a commission of $0.0035 per share to simulate the costs of a standard brokerage account. This rate is typical at Interactive Brokers, for example.
To mitigate the performance drag caused by frequent, small rebalancing actions, often required by the volatility-targeting sizing rules, the authors introduced a Rebalance Threshold.
- How it Works: A trade is only executed if the required adjustment in shares exceeds a specific percentage (e.g., 5%, 10%, or 20%).
- The Benefit: Implementing a 5% threshold reduced the total number of trades by 65%.
- Performance Insight: Surprisingly, the authors found that less frequent rebalancing actually increased total profits, even when trading costs were zero. This suggests that ignoring small fluctuations helps avoid the “drag” of short-term mean reversion during medium-term trends.
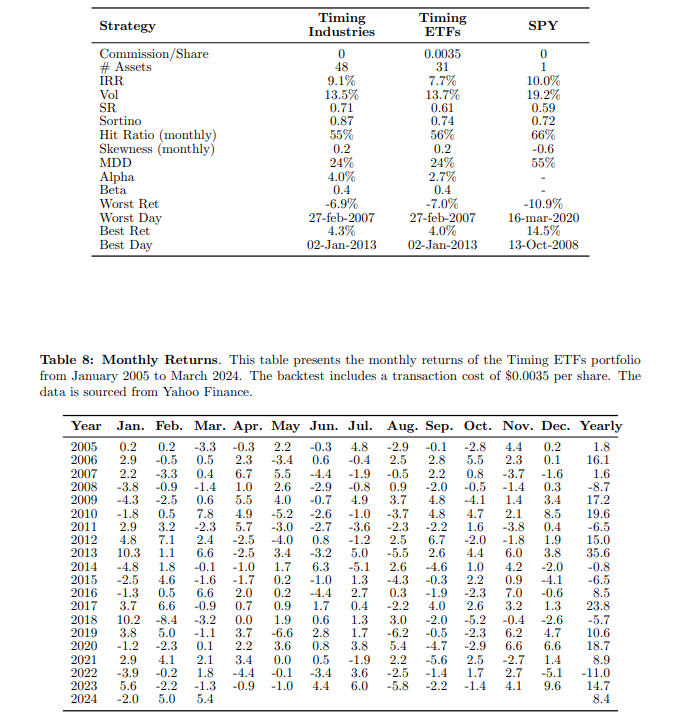
Performance Results (2005–2024)
Even with the inclusion of trading costs, the trend following strategy by industry using ETFs demonstrated superior risk-adjusted characteristics compared to a passive market exposure (SPY):
- Sharpe Ratio: The Timing ETF strategy achieved a 0.61, outperforming the market’s 0.59.
- Annualized Alpha: The strategy generated 2.7% alpha per year over the market.
- Drawdown Protection: While the S&P 500 suffered a maximum drawdown of 55% during this period, the Timing ETF strategy limited its losses to just 24%.
- Risk Reduction: The strategy maintained a Beta of 0.40, as it often only held a subset of the strongest ETFs, thereby significantly reducing overall market risk.
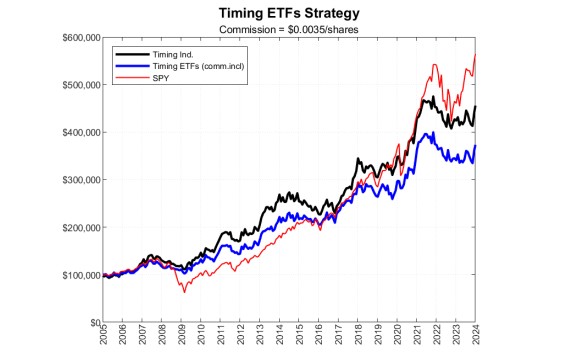
The authors conclude that ETFs are an effective tool for capturing industry trends and that the strategy remains profitable even after accounting for high levels of commissions
Conclusion for Investors
The research by Zarattini and Antonacci highlights that industry-based trend-following is not just a historical curiosity but a robust, tradable strategy. By combining established technical breakout methods with modern risk management, investors can potentially achieve higher returns with significantly lower tail risk. The trading rules are reasonably simple, so even retail traders can employ the strategy.