RSI 2 Strategy: Complete Guide To Larry Connors’ 2‑Period RSI Trading Rules
The RSI 2 strategy stands as one of the most researched mean reversion approaches in systematic trading. Developed by Larry Connors in the late 1990s and refined through his books “Street Smarts” (1996) and “Short Term Trading Strategies That Work” (2008), this trading strategy exploits the extreme sensitivity of a 2 period RSI to capture short-term price reversals.
The core philosophy is straightforward: buy during short-term panic when the market shows oversold conditions, and sell during euphoria when overbought conditions appear—but only when aligned with the dominant long term trend. Unlike momentum traders who chase breakouts, RSI 2 traders position themselves to profit when market prices return to their mean after temporary overextensions.
Larry Connors research focused primarily on daily bars applied to stocks and stock indices like SPY and QQQ. The research from quantifiedstrategies.com has validated these findings, demonstrating through extensive backtests that short-lookback RSIs consistently generate higher win rates and better risk-adjusted returns compared to the standard RSI 14. This guide covers the complete trading rules, practical filters, real-world examples, risk management protocols, and adaptive variations you need to implement this simple strategy effectively.
What Is the 2-Period RSI? (RSI(2) Explained)
The relative strength index (RSI) is a momentum oscillator that measures speed and magnitude of recent price changes, producing a value bounded between 0 and 100. The standard RSI uses 14 periods, but the RSI 2 compresses this calculation to just two bars, creating an indicator of extreme sensitivity.
The formula follows Wilder’s original calculation: RSI = 100 – (100 / (1 + RS)), where RS equals the average gain of up closes divided by the average loss of down closes over the lookback period. With only two data points, the math becomes remarkably reactive. A single large down candle can push RSI 2 below 5, while two consecutive strong up days can spike it above 95.
Consider a practical example: if a stock drops 3% on day one and 2% on day two with no up moves, RSI(2) might hit zero, signaling extreme oversold conditions. Conversely, back-to-back 2% gains could drive it near 100.
This sensitivity creates a stark contrast with RSI(14). The longer lookback smooths data and produces fewer rsi signals, making it better for trend confirmation. RSI(2), however, generates frequent trades—sometimes multiple signals per month on volatile stock indices—but demands strict trend filtering to avoid false signals. The tradeoff is clear: more opportunities for systematic traders, but higher noise without proper filters.
Larry Connors’ Classic RSI 2 Strategy Rules
Larry Connors established himself as a pioneer in quantitative short-term trading systems. His work with collaborator Cesar Alvarez from the mid-1990s through 2010 produced rigorous backtests demonstrating win rates exceeding 70-85% on broad indices when following specific trading rules.
The classic long-only setup begins with trend identification using a 200-day simple moving average (SMA 200). Connors recommends only taking long trades when the current price closes above this moving average, establishing a bullish market bias. This filter ensures traders buy pullbacks within uptrends rather than catching falling knives in downtrends.
A buy signal triggers when RSI(2) closes below a very low threshold, typically 5 or 10, indicating a sharp short-term selloff has created a potential buying opportunity. Entry occurs at the market close of the signal day. Connors prefers on-close orders to capture the exact signal, though this introduces overnight gap risk that some traders mitigate with next-open orders.
Exit rules offer more flexibility. The original research tested variations including closing when RSI(2) exceeds 65-75, or when price crosses above a 5-day SMA. Connors’ data suggested that buy RSI(2) < 2 with exit > 65 produced strong results, as did buying RSI(2) < 10 with a 5-day SMA exit.
For bearish signal setups, the rules mirror: when price closes below SMA 200, a short position triggers when RSI(2) spikes above 95, with exit below the 5-day SMA or when RSI(2) drops below 25-30. Notably, Connors’ research found that fixed stop-losses often reduced performance for this reversion strategy, as they frequently exited positions prematurely before the expected bounce materialized.
Step-By-Step RSI 2 Strategy Workflow
Translating rules into a daily routine requires systematic execution. Here’s how an experienced trader applies the RSI 2 strategy each trading session.
Step 1: Trend Filter Scan. Before market close, scan for instruments closing above their 200-day SMA for potential long position candidates. For short trades, identify those closing below the SMA 200. This establishes whether the market supports mean reversion entries in either direction.
Step 2: Signal Generation. Among qualifying instruments, identify where RSI(2) has dropped below your chosen threshold—typically below 5 for aggressive entries or below 10 for more signals. For shorts, look for RSI(2) above 90-95. This step narrows your watchlist to actionable setups.
Step 3: Order Placement. Execute via market-on-close orders to capture the signal day’s close, or place next-day market or limit orders to mitigate gap risk. On-close orders reduce slippage but add holdover exposure; next-open orders offer more control but may miss fast-moving reversions.
Step 4: Exit Logic. Monitor positions for exit triggers: RSI(2) crossing above 60-70, or price closing above the 5-day SMA, whichever rule your backtesting validated. Most RSI 2 trades produce quick exits within 3-7 days.
A concrete example from October 2022 illustrates this workflow. SPY maintained an uptrend above SMA 200 when a 2-3 day dip pushed RSI(2) below 5 on October 7 (close approximately 357). Entry at close triggered the position. Price rebounded, crossing above the 5-day SMA roughly 3 days later near 365, yielding approximately 2% gain after costs.
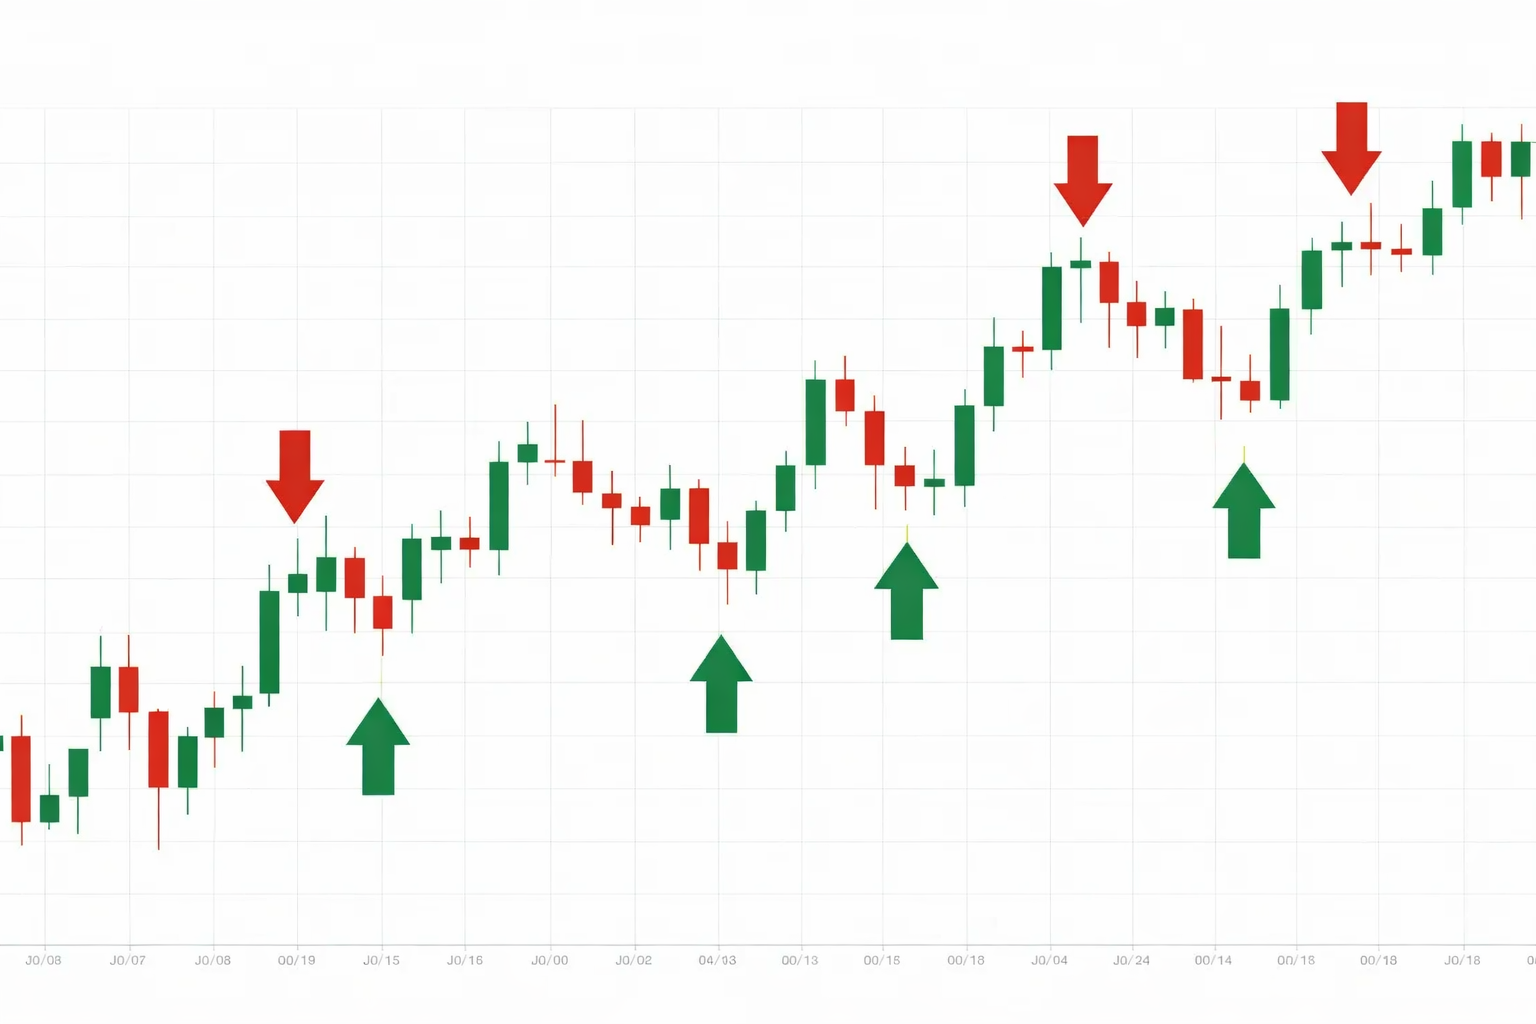
Practical Examples of RSI 2 Signals on Charts
Concrete examples make abstract rules tangible. Two historical cases demonstrate how RSI 2 signals develop and resolve in real market conditions.
Example 1: Bullish Signal on SPY (April 2020). During the March 2020 crash recovery, SPY established itself above a rising SMA 200 (approximately 280). A sharp 2-day drop from April 7-8 drove price from 266 to 248, plunging RSI(2) to 2.1—a textbook oversold reading. The buy signal triggered at April 8’s close. By April 10, price crossed above the 5-day SMA near 259, capturing a 4.4% gain in just 2 days despite an initial wick lower post-entry. This demonstrates how the strategy capitalizes on panic dips within established uptrends.
Example 2: Bearish Signal on QQQ (September 2022). With QQQ trading below SMA 200 (approximately 280), a short squeeze pushed RSI(2) to 96 after consecutive up days moved price from 265 to 272. This identified overbought conditions ripe for mean reversion. A short position entry at close led to exit 3 days later when price dropped below the 5-day SMA near 268, generating approximately 1.5% profit.
These examples reveal important realities. RSI signals often appear early—price action may continue against your position before reverting. The SPY example wicked 2% lower post-entry before recovering. Execution matters significantly: entering at open rather than close added 0.2-0.5% slippage in tested scenarios. Time stops preventing outliers from dragging on portfolios remain prudent additions to pure RSI exits.
RSI 2 Strategy Backtest
Let’s backtest the RSI 2 strategy.
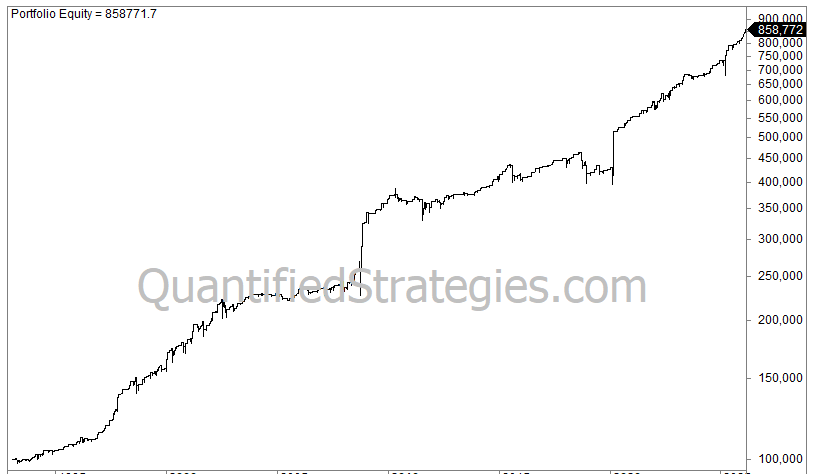
First, we backtest buying when the RSI 2 drops below 10 and sell when it crosses above 80. This is for SPY, the ETF that tracks the S&P 500 from 1993 until today:
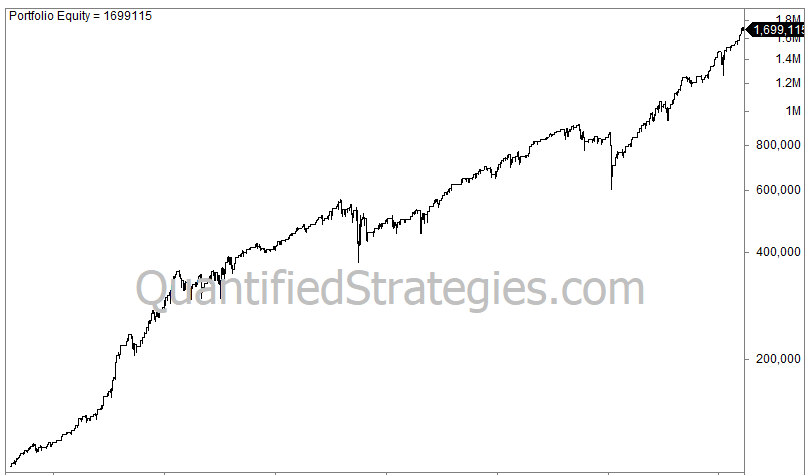
The average gain per trade is 0.9%, Annual returns are 9%, max drawdown is 34%, and you are invested 28% of the time.
Second, we backtest using a trend filter: only take trades above the 200-day moving average:
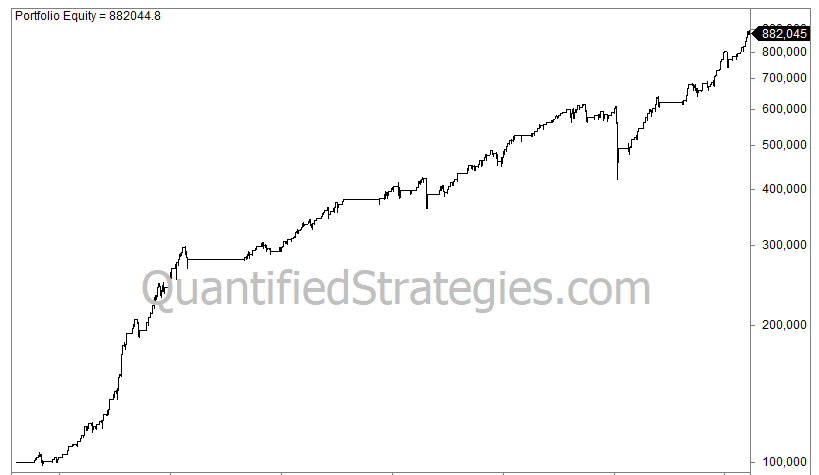
The average gain per trade increases to 0.95%, max drawdown is reduced to 31%, but CAGR drops to 6.8%. You are invested 18% of the time.
We change the sell signal to when the close ends above yesterdays high and skip the trend filter of 200-day moving average:
Average gain per trade drops to 0.5%, but drawdown is reduced to only 15%. All in all, we believe these are good metrics because the drawdown is reduced. The win rate is 76%.
Improving and Filtering RSI 2 Signals
Raw RSI(2) entries generate noise that benefits from additional confirmation layers. Several filter types consistently improve results.
Dual-Trend Confirmation. Require price to close above both SMA 200 and SMA 50 for long entries. This avoids choppy, range-bound markets where mean reversion performs poorly. Backtests show this filter boosts win rates by 5-10% while reducing signal frequency.
RSI Cross-Back Filter. Rather than entering immediately when RSI(2) drops below 5, wait for it to tick back above 5-10 before committing capital. This confirms selling pressure is easing and reduces whipsaw entries by approximately 20%.
Volume and Volatility Filters. Skip signals on days with below-average volume (less than 50% of typical) or when VIX spikes above 30. These conditions often precede news-driven gaps that undermine mean reversion assumptions.
Time-Based Exclusions. Avoid entering positions immediately before major macro events like FOMC announcements, CPI releases, or earnings reports. Studies indicate this filter cuts gap-related losses by 15-25%.
Intraday Confirmation. For traders monitoring markets during the session, combining daily RSI(2) signals with 30-minute reversal candlesticks or intraday RSI readings adds an execution edge.
When combined, these filters can lift trade expectancy from approximately 0.3% to 0.6% per trade on major indices—a meaningful improvement for systematic trading systems.
Risk Management and Exit Strategies for RSI 2
A high win rate does not eliminate the need for strict risk control. RSI 2 strategies occasionally face extended trends that punish mean reversion traders repeatedly, making position sizing and exit discipline essential.
Connors’ original research suggested fixed stop-losses reduced performance on S&P 500 backtests from the 1990s-2010, as stops frequently triggered before the expected bounce. However, modern traders typically implement some protective measures:
Volatility-Based Stops. Set stops at 2x ATR(10) from entry. On SPY with ATR of 3 points, this means a stop approximately 6 points below entry, risking roughly 1.5% on the position.
Capital-Based Stops. Risk a maximum percentage of equity per trade, typically 0.5-2%. This prevents any single losing trade from significantly damaging the equity curve.
Time Stops. Exit after 5-10 bars if no mean reversion occurs. This prevents positions from lingering indefinitely in slow-developing adverse moves.
Exit strategies offer traders more flexibility beyond simple RSI thresholds:
- RSI-Based Exit: Close when RSI(2) exceeds 60-80, signaling the reversion has played out
- Moving Average Exit: Close when price crosses above the 5-day SMA or reaches a prior swing high
- Partial Profit Taking: Exit 50% at the first target, trail the remainder using ATR-based stops
Position sizing deserves special attention. RSI(2) signals cluster during market corrections, potentially creating multiple simultaneous positions. Capping total exposure at 10% of portfolio prevents correlation-driven blowups when several trades move against you simultaneously.
Variations of the RSI 2 Strategy (Pullbacks, Intraday, and Multi-Timeframe)
Connors’ classic rules serve as a foundation that traders adapt for different markets, timeframes, and trading styles.
Pullback Strength Filters. Require three consecutive bars with RSI(2) below 10 before entering long positions (or above 90 for shorts). This targets capitulation events where selling exhaustion is more likely, producing 10-15% higher win rates at the cost of fewer trading opportunities. This approach suits swing trading timeframes well.
Intraday RSI(2) Strategies. Apply RSI(2) to 30-minute or 60-minute bars on major index CFDs like US500. Thresholds typically widen to below 10 and above 90 due to increased noise. This generates more signals (20-50 monthly) but lower per-trade profit (0.2-0.4%), making intraday trading execution costs critical. Backtests from 2024-2025 confirm viability post-commissions for low-cost traders.
Multi-Timeframe Approach. Combine a longer-term indicator like daily RSI(14) above 50 with hourly RSI(2) undershoots below 5. This aligns entries with dominant momentum, reducing drawdowns by 20-30% in trending market regimes compared to single-timeframe approaches.
Day Trading Adaptation. For active day trading, some traders use RSI(2) on 5-minute charts with wider thresholds (below 15, above 85) and faster moving averages for exits. This requires significantly more screen time but can identify major tops and bottoms within single sessions.

RSI 2 Scans and Stock Screeners
Manual chart scanning becomes impractical when monitoring hundreds of potential setups. End-of-day screeners automate RSI 2 discovery efficiently.
Long Scan Criteria:
- Market price closes above SMA 200
- RSI(2) below 5 or 10
- Average daily volume exceeds 500,000 shares
- Price above $5 minimum threshold
Short Scan Criteria:
- Price below SMA 200
- RSI(2) above 90 or 95
- Same liquidity filters apply
Platforms like TradingView, Thinkorswim, or custom Python scripts enable these scans at market close, generating watchlists of 5-20 candidates daily from the S&P 500 universe.
Refinement options include filtering for price deviation from shorter moving averages—for example, requiring price to be 9% or more below the 10-day SMA for “deep” oversold extremes. This identifies stronger mean reversion candidates at the cost of fewer signals.
After generating candidates, apply manual checks: verify no imminent earnings announcements, confirm the chart shows clean price action rather than news-driven chaos, and assess whether the green arrow of a reversal candlestick supports the signal. This combination of automated scanning and human judgment produces the strongest trade selection.
Backtesting and Performance Insights for RSI 2
Any RSI strategy requires historical validation before committing capital. Systematic testing reveals both the potential and limitations of RSI 2 approaches.
Published research and public backtests on SPY and QQQ from 1993-2025 consistently show:
| Metric | Typical RSI(2) Results |
|---|---|
| Win Rate | 70-80% |
| Average Win | 0.5% per trade |
| Risk/Reward | 1:1.5 |
| CAGR | 8-12% |
| Maximum Drawdown | 20-30% |
Short lookback RSIs (2-3 periods) outperform longer settings like RSI(14) on broad stock indices because stocks exhibit strong tendencies for quick bounces after 1-2 day panics. The indicator captures these reversions more reliably than smoothed alternatives.
Performance degrades significantly during prolonged bear markets. The 2008 financial crisis and March 2020 crash saw win rates drop below 60% as “buy the dip” repeatedly failed. Regime filters like requiring VIX below 25 help avoid these periods.
Robustness testing matters. Walk-forward analysis varying thresholds between 4-12 confirms the edge isn’t curve-fit to specific parameter values. Include realistic transaction costs (0.02% slippage plus commissions) in all tests. Out-of-sample validation from 2015-2025 shows slight performance decay from increased HFT competition, but the core strategy retains a profitable edge.
Common Pitfalls When Trading the RSI 2 Strategy
Many traders misuse RSI(2) by ignoring its inherent limitations, leading to preventable losses.
Wrong Asset Classes. Applying RSI 2 blindly to highly trending markets like forex or commodities yields sub-50% win rates. The mean reversion strategy works best on equities where stocks tend to bounce after short-term panic. Market bias differs fundamentally across asset classes.
Ignoring the Trend Filter. Buying oversold rsi levels in strong downtrends leads to catching falling knives. Unfiltered RSI(2) trading during the 2022 bear market produced 15% losses on clustered sell signal failures. The SMA 200 filter exists for critical reasons—use it.
Overleveraging. High win rates create false confidence. Losing streaks of 5-10 consecutive trades cluster during corrections. Traders sizing positions based on recent success often face margin calls when the inevitable streak arrives.
Over-Optimization. Tweaking thresholds to 4.7 instead of 5 based on in-sample data creates fragile systems that fail during live trading. Keep parameters round and robust. If RSI(2) < 5 works, so will < 4 and < 6—precision suggests curve-fitting.
Signal Clustering. During market stress, RSI 2 generates multiple simultaneous signals across correlated positions. Without exposure caps, traders find themselves holding 10+ positions that all move against them together. Diversification across 20-50 symbols with total exposure limits prevents this scenario.
Conclusion: Is the RSI 2 Strategy Worth Trading?
The RSI 2 strategy developed by Larry Connors remains one of the simplest and most studied mean reversion tools available. Decades of backtesting across multiple market regimes confirm its core premise: stocks and stock indices tend to revert after short-term extremes, and a 2 period RSI captures these opportunities effectively.
Key principles for successful implementation include using the 200-day SMA as a trend filter, applying strict quantified entry and exit rules, and maintaining realistic expectations about drawdowns during adverse periods. The high win rate attracts traders, but profitable execution requires discipline around position sizing, exposure management, and avoiding the common pitfalls outlined above.
RSI 2 is not a holy grail. It represents one indicator among many—a robust building block that gains power when combined with appropriate filters, sensible risk controls, and portfolio-level diversification. The strategy struggles in trending bear markets and generates false signals without trend confirmation.
Test any RSI 2 variant on your intended markets and timeframes before trading real capital. Determine whether the historical edge persists with your execution costs and timeframe constraints. Integrate it into a broader, data-driven trading plan rather than relying on it as a standalone solution. The traders who succeed with RSI 2 treat it as a starting point for systematic development, not an endpoint.