
200 Day Moving Average Trading Strategy – (Backtest)
The 200-day moving average trading strategy is frequently used as an indicator in the financial markets. Who hasn’t heard about the “Death Cross”, “support at the moving averages”, “the trend is positive because the price is above the averages”, etc.?
This article looks at the 200 day moving average and how it works, why it works, and additionally why it sometimes doesn’t work. We present a 200-day moving average strategy and the simple 200-day moving average rule.
The main advantages of the 200-day moving average are simplicity, riding the trend, and playing defense. However, without a recession and falling prices, you are unlikely to beat buy-and-hold because of the many whipsaws. As with most things in life, the 200-day moving average comes with both pros and cons. The 200-day moving average strategy is no silver bullet. Jump to backtests and Jump to video
Key takeaways
- The 200-day moving average (200 DMA) is a widely utilized technical analysis tool that calculates the average closing price of a financial asset over the past 200 trading days.
- This indicator helps smooth out short-term price fluctuations, providing a clearer view of long-term trends.
- Traders often interpret prices above the 200 DMA as indicative of an uptrend, while prices below suggest a downtrend.
- It’s calculated by summing the asset’s closing prices over the last 200 days and dividing by 200.
- A common strategy involves buying when the asset’s closing price crosses above the 200 DMA and selling when it crosses below.
- Historically, the 200-day moving average trading strategy has delivered a competitive average annual return compared to a buy-and-hold approach, with some studies showing improved risk-adjusted performance across various asset classes.
- For more trading indicators, please visit the stock indicators list.
What is a 200 day moving average?
A 200-day moving average is a technical analysis indicator that calculates the average price of a financial asset over the past 200 trading days. This indicator is widely used across various asset classes, such as stocks, commodities, and cryptocurrencies. It’s used to smooth out short-term fluctuations and identify trends in the price movement of the asset.
A 200-day moving average is a type of simple moving average (SMA). A moving average is the sum of the x last closes divided by the same x. For example, a ten-day moving average summarizes the closing prices over the last ten days and divides the sum by ten. On the next day, the process is repeated by including the most recent close and dropping the eleventh most recent close.

On a price chart, the 200-day moving average appears as a smooth line, helping traders visually identify long-term trends by filtering out short-term market noise.
Simple moving averages like the 200-day MA are commonly used by traders to spot trends and support/resistance levels. The 200-day MA acts as a key, long-term trend-following tool that filters out daily market noise to identify overall direction.
Is moving averages a trend-following indicator?
Yes, moving averages are indeed trend-following indicators. They are essential for identifying trends and spotting trends in various market conditions. Traders often use shorter moving averages to capture short-term trends in the market. When the price is above the shorter moving average, it’s often considered bullish, indicating an uptrend, while when the price is below, it’s seen as bearish.
The main idea of a moving average is to capture market trends. The 200-day moving average is particularly valuable for identifying long term market trends and is widely used by traders to spot trends and confirm market direction. A moving average is an extremely simple tool to determine the trend: if the close is above the 200-day moving average, the trend is up. If the close is below, the trend is down.
It’s important to note that the 200-day MA is better suited for long-term investing rather than short-term trading due to its slow response to sudden price changes.
200 Day Moving Average Trading Strategy
Why a 200-day moving average, why not 183?
There is no particular reason to use a 200-day moving average (200 MA) than, for example, 183 days except that it’s a round number. You risk curve fitting if you optimize to another number of days. Furthermore, 200 days is a long average and thus captures the long-term trend.
However, there might be a reasonable explanation for why you could, for example, go for a 182-day moving average, or 213 for that matter: To avoid crowding.
Simple moving average vs exponential moving average
Simple Moving Average (SMA):
- Calculates the average price over a specific number of periods.
- Each data point has an equal weight in the calculation.
- Easy to understand and calculate.
- Prone to lag, as it gives equal weight to all data points regardless of recency.
Exponential Moving Average (EMA):
- Gives greater weight to recent prices, making it more responsive to current price movements.
- Helps traders identify trends earlier than SMA.
- More complex to calculate due to the inclusion of a smoothing factor.
- Can be more susceptible to false signals during choppy or volatile markets.
Most traders choose between two types of moving averages when they make moving average strategies: the simple moving average (SMA) or the exponential moving average (EMA). Technical analysts often use both simple moving averages and exponential moving averages as technical indicators to identify trends and overbought or oversold conditions. In this article, we use the simple moving average (SMA). We use the SMA because it’s the “simplest” – hence the name.
Paul Tudor Jones and the 200-day moving average

Paul Tudor Jones and the 200 moving average
Paul Tudor Jones, a famous hedge fund manager, is known for his use of the 200-day moving average as a key indicator in his trading strategies.
My metric for everything I look at is the 200-day moving average of closing prices. I’ve seen too many things go to zero, stocks and commodities. The whole trick in investing is: “How do I keep from losing everything?” If you use the 200-day moving average rule, then you get out. You play defense, and you get out.
Traders often watch the stock price’s position relative to the 200-day moving average to gauge market momentum and anticipate potential market corrections.
The main reason why the 200-day moving average works is that it keeps you out of a bear market. Look at what happened in the S&P 500 in 2007-09:

An example of a 200-day moving average strategy
The chart shows that the moving average took you out in late 2007 at 113, except for a false signal in May 2008. You reentered in May 2009 at 73 and held it for a long time, when quantitative easing pushed the markets higher.
And not to mention the oil price action in 2020:

The 200-day moving average can be used to trend follow the oil price
The chart shows that the average took you out at 65 in January 2020, and you reentered in October and November 2020 at around 40.
The 200-day moving average is often viewed as a psychological floor (support) or ceiling (resistance) in market trends, influencing trader behavior during major market corrections. The 200-day moving average works when you have recessions because it takes you out before a bear market hits. It saves you money, and you can start compounding again at higher levels.
Video – 200 Day MA
When the 200-day moving average is not working
The GFC in 2008/09 is a perfect example of explaining how such a moving average is useful. However, when there is no significant bear market, the moving average might fail to work properly.
The reason is simple: the 200-day moving average works mainly because it keeps you out of bear markets. Obviously, if it’s no bear market, you will underperform compared to buy and hold.
The 200 day moving average strategy on the S&P 500 (Backtest)
Let’s backtest this simple 200 day moving average strategy with the following trading rules:
- Buy when the closing price crosses above the 200-day moving average.
- Sell when the closing price crosses below the 200-day moving average.
This crossover system is straightforward and widely used. High trading volume accompanying a breakout above or below the 200-day MA may confirm the reliability of the breakout signal.
When backtested on the S&P 500, the 200 day moving average trading strategy has historically reduced drawdowns compared to a buy-and-hold approach. The average annual return of the 200-day moving average strategy can be slightly lower or similar to buy-and-hold over the same period, but with less volatility and smaller maximum drawdowns. This comparison can vary across different asset classes, such as stocks, commodities, or cryptocurrencies.
It’s important to note that market conditions, including volatility and trend strength, can impact the effectiveness of the 200-day moving average strategy.
Trading rules
- Buy when the close of the S&P 500 crosses above the 200-day average,
- Sell when it closes below the average.
This is a crossover system. Here is the return (log chart) of investing 100 000 in 1960 and reinvesting and compounding until today:
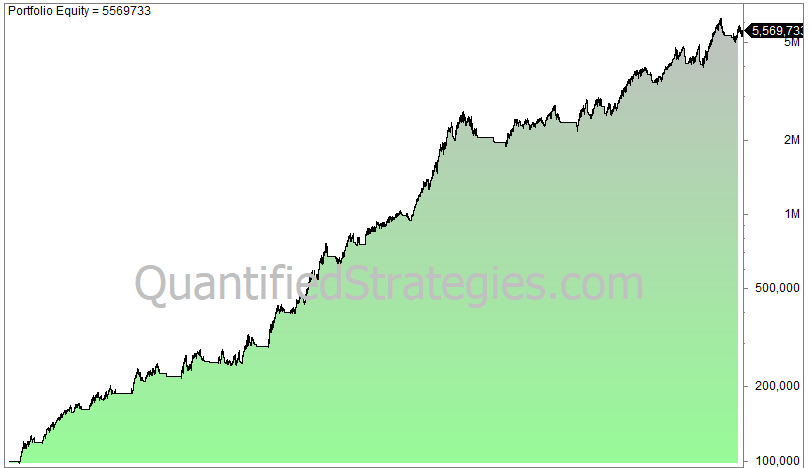
200 day moving average strategy

Reduce risk by using a 200 day average filter
The 200DMA strategy has worked remarkably well:
- 199 trades since 1960.
- CAGR is 6.75, buy and hold is 7% (reinvested dividends not considered).
- 2.4% average gain per trade.
- Max. drawdown is 28%, buy and hold drawdown is 56%.
The 200-day moving average strategy has almost kept pace with the S&P 500 while experiencing substantially lower drawdowns. The downside is that you might face tax bills because of the non-deferred capital gains.
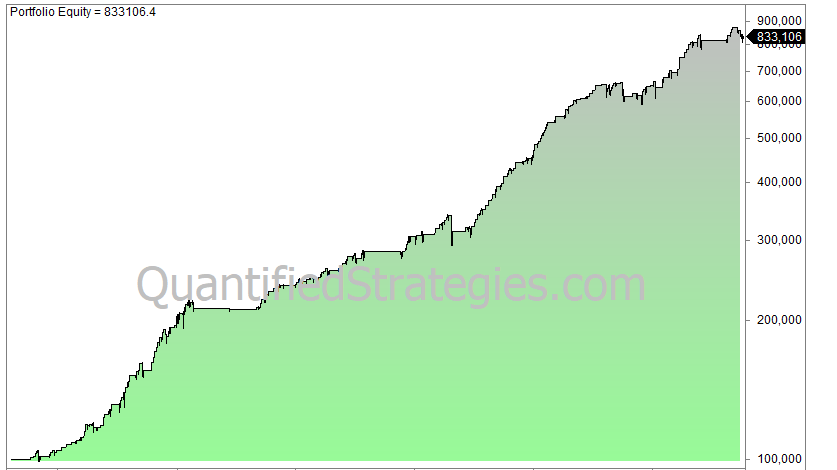
The S&P 500 since the GFC in 2007/08:
However, the strategy is likely to underperform in the absence of a prolonged recession and falling prices.
Let’s backtest the 200-day moving average strategy from the bottom in March 2009 until today:

200 day average strategy bull market
The CAGR is 8.5%, but that is dwarfed by the buy-and-hold CAGR of 12.8%. Max drawdown is still lower at 19% vs. 34%.
There are no major recessions. As long as the markets keep going up, the 200-day moving average strategy will get a lot of whipsaws and never keep up with buy-and-hold.
A perfect example is what happened in 2010:

200-day moving average whipsaw
During the summer of 2010, you would face 7 trades of which only one showed a gain. However, the losses were offset by the last trade entered on the 29th of October, which kept you in until July 2011 with a nice gain.

Jeremy Siegels Twist on the 200 Day Moving Average Strategy
The RSI (and other indicators) and the 200 day moving average strategy:
The beauty of backtesting is that you can test a lot of ideas in literally just seconds. Let’s first test how we can utilize the 200 day moving average strategy.
The core strategy is as follows:
- Enter at the close when the S&P 500 closes below a five-day RSI of 35.
- Sell at the close when the same five-day RSI crosses above 50.
The 200-day moving average can help traders plan trade entries and identify opportunities for long positions when the price is above the average, as it often acts as a dynamic support or resistance level.
This strategy returns the equity curve in SPY from 1993 until today (SPY):

RSI and the 200 day moving average
These are the facts about the strategy:
- The number of trades is 379, and the average gain per trade is 0.7%.
- The win ratio is 76%.
- CAGR is 8.7%, buy and hold is 9.8%.
- Max drawdown is 29%.
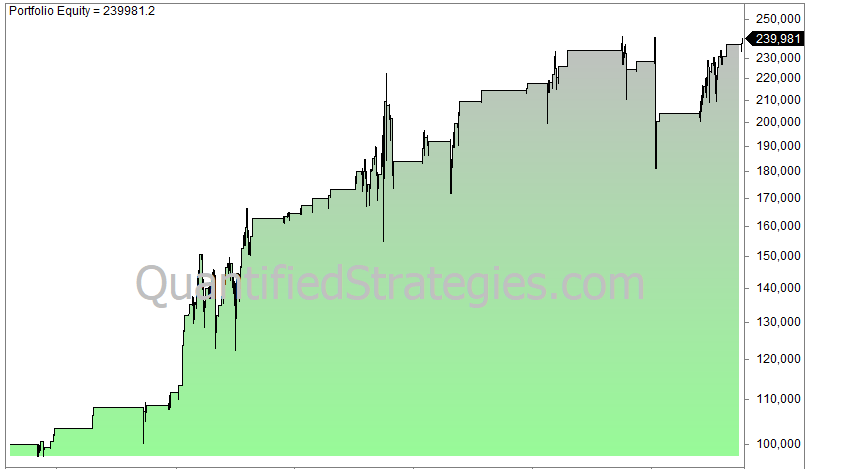
What happens if we add a 200-day moving average filter? The strategy is the same, but the close needs to be above the 200-day moving average to generate a signal.
The equity curve gets slightly better:
200 day moving average and RSI
When we add the trend filter, the strategy yields these numbers:
- The number of trades is 258, and the average gain per trade is 0.85%.
- The win ratio is 81%.
- CAGR is 7.1%, buy and hold is 9.8%.
- Max drawdown is 14%.
It’s important to note that the 200-day moving average is a lagging indicator, based on historical data, and may respond slowly to sudden price changes.
As you can see, the total return is lower because of fewer trades and less time spent in the market, but the upside is that you get a much lower drawdown and better win rate.
If we trade the strategy only when the close is below the 200-day average we get this equity curve:
- The number of trades is 138, and the average gain per trade is 0.7%.
- The win ratio is 68%.
- CAGR is 2.7%, buy and hold is 9.8%.
- Max drawdown is 25%.
200-day moving average crossover systems and strategies
Moving averages can also be employed in moving average crossover systems. A crossover system is, for example, if you use the 50-day and 200 day moving average and take trades when the shorter moving average (50-day) crosses above and below the longer moving average (200-day).
A golden cross is a bullish signal that occurs when the 50-day simple moving average (SMA) crosses above the 200-day SMA, indicating a potential rise in price. Conversely, a death cross happens when the 50-day SMA crosses below the 200-day SMA, signaling an upcoming bear market. Understanding death crosses and golden crosses is crucial for traders, as these are key signals for spotting major trend changes. Golden and death crosses are widely used in technical analysis to identify potential market reversals and shifts in momentum.
Volatility above and under the 200 day moving average
Price behavior in most markets differs between bull and bear markets. During a bull market, volatility tends to decline, while in a bear market, it tends to rise. When prices stay above the 200-day moving average, it often signals strong market momentum and a sustained uptrend.
If we look at the statistics of the S&P 500, the difference is huge:
- Above the 200-day moving average: 1.05%
- Below the 200-day moving average: 2.1%
The 200-day moving average often acts as a dynamic support level in an uptrend and a resistance level in a downtrend, influencing price behavior and volatility.
The price action is completely different depending on the price being above or below the long-term moving average.
Time spent above the 200-day moving average
Markets that have a long-term upward bias, like stocks and the price of gold, spend most of the time above the 200-day moving average. The 200-day moving average is often seen as a level of potential support during uptrends and potential resistance during downtrends, acting as a dynamic support or resistance level.
This dynamic role helps explain why markets spend significant time above the 200-day moving average. For example, the S&P 500 has spent 70 percent of the time above since 1960 and 85% of the time since 2010.
The 200-day moving average strategy and its whipsaws
The moving average would have done a great job in keeping you out of the markets in 2000-03 and 2007/09. However, it comes at a price: There are plenty of whipsaws and false signals. Since 1960, it has crossed above the average 187 times. But astonishingly, only 28% of the trades turn out to be winners!
Risk management and stop-loss levels
Effective risk management is at the heart of any successful trading strategy, and the 200-day moving average can play a pivotal role in this process. By leveraging the 200 day moving average as a reference point, traders can set stop-loss levels that align with the prevailing trend direction and help protect against significant losses.
In an upward trend, the 200-day moving average often acts as a dynamic support level. Traders can use this to their advantage by placing stop-loss orders just below the 200 day moving average or beneath recent swing lows. This approach helps safeguard positions if the price reverses and breaks through this key level, signaling a potential shift in market direction.
Conversely, during a downward trend, the 200-day moving average may serve as resistance. In such bearish conditions, setting stop-loss levels just above the 200 day moving average or above recent highs can help limit losses if the market continues to move lower.
Market volatility is another crucial factor to consider when setting stop-loss levels. In volatile markets, price action can be erratic, leading to false signals and premature stop-outs. To address this, traders often use the average true range (ATR) to gauge market volatility and adjust their stop-loss distances accordingly. A wider stop-loss may be necessary in high-volatility environments to avoid being taken out by short term price fluctuations, while tighter stops can be effective in more stable conditions.
Incorporating other indicators, such as the exponential moving average or momentum indicators, can further refine stop-loss placement. For example, if both the 200-day moving average and the exponential moving average confirm an upward trend and momentum indicators show strong upward momentum, traders might opt for a more aggressive stop-loss just below recent support. On the other hand, if downward momentum is building below the 200 day moving average, a more conservative stop-loss above resistance may be warranted.
Risk tolerance is highly individual and should always be factored into stop-loss decisions. Some traders may prefer to risk a smaller percentage of their capital per trade, while others are comfortable with wider stops to capture larger price movements. The key is to balance the need for protection against market noise with the desire to stay in trades that align with the long term trend analysis.
Ultimately, the 200-day moving average is a valuable tool for identifying long term trends and setting effective stop-loss levels. By combining it with other technical indicators, monitoring market volatility, and adjusting for personal risk tolerance, traders can enhance their risk management and improve their chances of long-term success in trending markets.
Related reading: What is the 200 MA strategy and Which Time Frame Is Best For 200 MA
FAQ 200DMA
Based on the number of e-mails we get we decided to make a FAQ to better address any issues about the 200-DMA:
14.1 What is the 200-day moving average?
The 200-day moving average (200DMA) is a technical indicator that calculates the average closing price of an asset over the past 200 trading days. It is commonly used to identify long-term trends in the market.
14.2 Can the 200DMA act as support or resistance?
Yes, the 200DMA can act as both support and resistance levels, depending on the market direction. When the price is above the 200DMA, it may act as a support level, while if the price is below, it can serve as a resistance level that the price needs to break through to confirm a trend reversal or continuation.
14.3 Is the 200DMA useful for day trading?
Day trading strategies often use shorter moving averages because the 200DMA is a lagging indicator, based on historical data, and is less responsive to rapid price changes. Day traders typically rely on moving averages with shorter periods to make quick decisions and assess market trends within short timeframes.
14.4 How is the 200DMA calculated?
The 200DMA is calculated by adding up the asset’s closing prices for the last 200 trading days and then dividing the total by 200.
14.5 What data points are used to plot the 200DMA?
The data points used to plot the 200DMA are the asset’s closing prices over the last 200 trading days.
Which time frame is best for 200 DMA?
There is no best or worst time frame. Only a backtest can tell what works or not. Daily bars are most frequently used. If you use weekly bars, a 200-day average is about 4 years of data.
Should you buy below the 200-day moving average?
Only a backtest can tell you is you should buy below the 200-day moving average. The 200-day moving average has worked pretty well to filter trends in the stocks market.
What is best, SMA 200 or EMA 200?
A backtest finds out if the SMA 200 or EMA 200 is the best. Overall, we like to use SMA because it’s simple.
What does it mean when a stock goes below its 200-day moving average?
When a stock goes below its 200-day moving average it means the stock enters a bear market. This doesn’t necessarily mean it’s not tradable, perhaps even the contrary, as we have successfully traded stock market indices when they are below their 200-day moving average.
How do you plot a 200DMA?
You plot a 200DMA by following this process:
- Gather the data points for the 200-day moving average. These data points are the 200-day average closing prices of a stock. 2. Plot the data points on a price chart. 3. Connect the data points with a line to create a smooth line, which helps traders visualize long-term trends by reducing short-term fluctuations. However, any software platform makes this in a hundredth of a second.
What’s the 200 DMA rule?
If the price is above the 200-day MA, it is generally considered to be in an uptrend, and if it is below the 200-day MA, it is in a downtrend.
Conclusions about the 200-day moving average strategy:
This article has highlighted some facts about the 200-day moving average. It’s an effective filter.
Moreover, as a trader, you might not be interested in beating a buy and hold strategy but simply use a 200-day moving average strategy to keep you out of trouble.