
Bearish Kicker Candlestick Pattern Trading Strategy: (Statistics, Facts, & Historical Backtest)
The bearish kicker candlestick pattern is presumably one of the most effective bearish reversal patterns that can explicitly define the potential bearish momentum and flow of price action. It is characterized by a large, downward-moving candle that appears after an uptrend.
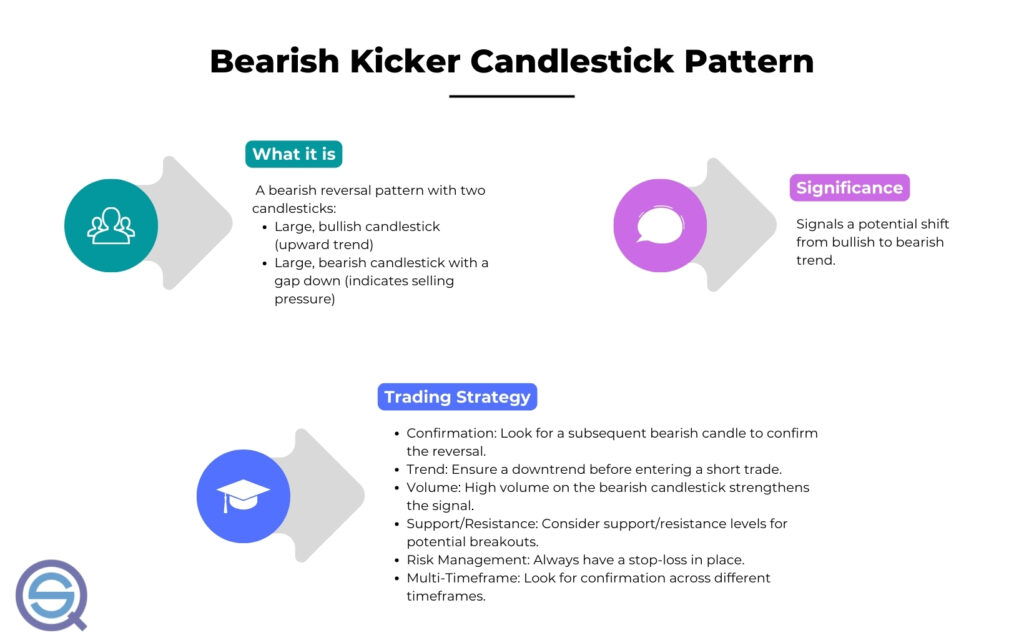
The bearish kicker candlestick pattern indicates a potential shift from bullish to bearish. It is also considered a valuable and strong reversal signaling tool for traders and investors to identify possible selling opportunities. In this article, we will discuss the characteristics and significance of the bearish kicker pattern, as well as how to identify and trade it effectively.
Key Takeaways
- Two-candle pattern shows strong bearish reversal signal.
- Forms after uptrend with gap-down bearish candle.
- Indicates sudden shift from bullish to bearish sentiment.
- Rare pattern, appears infrequently in markets.
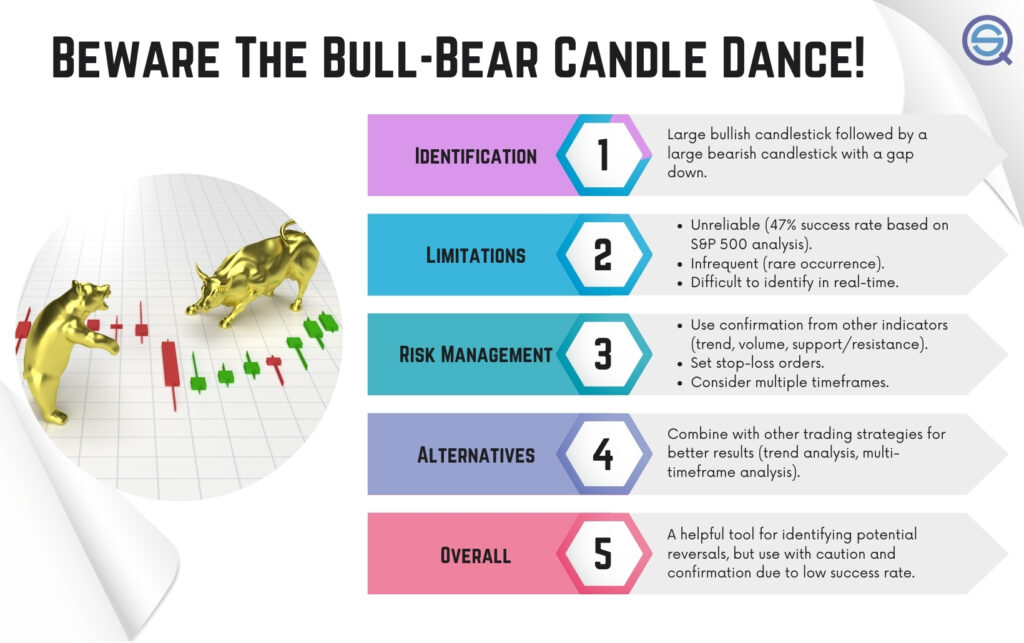
- Low reliability with around 47% success rate.
- Requires confirmation using volume and indicators.
- Best used with trend and multi-timeframe analysis.
- Strong risk management essential due to false signals.
Graphical representation – what does the Bearish Kicker look like?
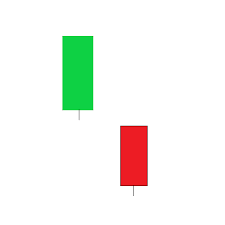
The Bearish Kicker might look like this:
Bearish Kicker Candlestick Pattern Backtest
We recommend backtesting absolutely all your trading ideas – including candlestick patterns.
To backtest candlestick patterns you need to set specific rules and definitions. That requires both time and effort, but don’t worry: it’s already done for you!

We have defined ALL 75 candlestick patterns and put them into strict testable trading rules. Each candlestick pattern is backtested and includes rules, settings, statistics, probabilities, and performance metrics.
Even better, you get the rules with Amibroker or Tradestation/Easy Language code (in addition to plain English if you like to code yourself, like putting it into a Python trading strategy, for example).
Click here to read more or order.
What is A Bearish Kicker Candlestick Pattern?
A bearish kicker candlestick pattern is a double candlestick pattern with a long bullish candlestick followed by a significantly long bearish candlestick, with the bearish candlestick opening either at or above the high of the bullish candlestick.
The bearish kicker pattern is considered a reliable reversal signal because it shows a sudden shift in sentiment from bullish to bearish. The long bullish candlestick shows strength in buying pressure, while the long bearish candlestick shows a sudden change and surge in selling pressure. This sudden shift in trending bias could seem like an anomaly. However, it indicates a sudden market takeover by the bulls from the bears.
Confluence like high trading volume and multi-timeframe confirmation add to the reliability of a bearish kicker candlestick pattern as a reversal signal. It is typically found at the end of an uptrend and warns that the trend may be about to reverse.
It’s essential to be cautious when you use the bearish kicker pattern, as it is not always reliable and may be followed by a continuation of the bullish trend. However, when combined with other technical indicators, fundamental analysis, and trading strategies, it’s a valuable tool for identifying potential reversal points in the market and can improve your efficiency and profitability as a trader.
How is a Bearish Kicker Candlestick Pattern Identified?
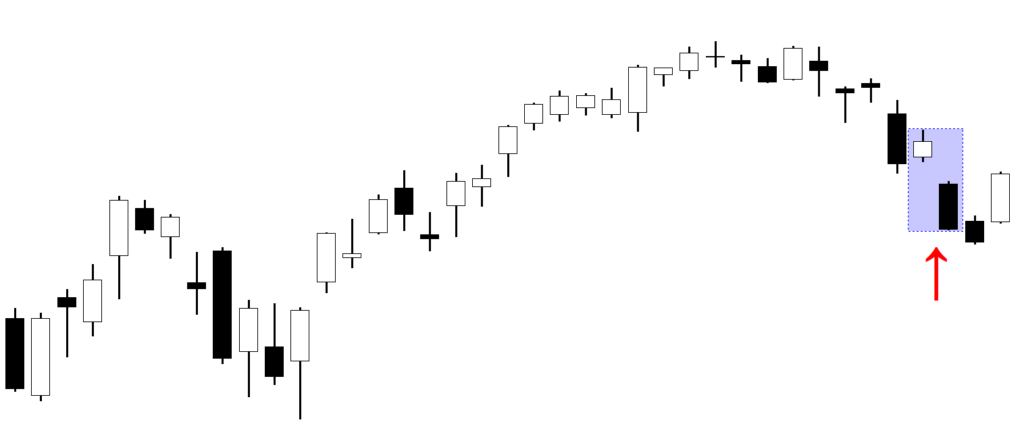
A bearish kicker candlestick pattern is a bearish reversal pattern identified by a long bullish candlestick followed by a bearish candlestick with a gap between them. The gap between the two candlesticks indicates that there has been a significant shift in sentiment from bullish to bearish.

This pattern is often a warning sign for a potential trend reversal. Understanding how to incorporate them into your trading strategy gives you lots of edge as a trader. To accurately identify a bearish kicker candlestick pattern, you should look for the presence of a significantly bullish candlestick followed by a large bearish candlestick with a gap between them, as shown in the chart image below:
How Reliable is the Bearish Kicker Candlestick Pattern as a Trading Signal?
The bearish kicker candlestick pattern is not a reliable trading signal because it happens rarely. However, the rallying concerns about how reliable the bearish kicker candlestick pattern is has more than one answer.
Overall, the bearish kicker helps predict an intending bearish momentum of the price, which starts as two candle indicators that appear as a quick flip of a full-blown bullish candlestick to a full-blown bearish candlestick with a gap in between.
Several factors contribute to the reliability of the bearish kicker pattern as a trading signal. First, the significant downward gap between the two candlesticks suggests a substantial shift in momentum from bullish to bearish. This gap also indicates a significant difference in the opening and closing prices of the two candlesticks, which can serve as a strong indicator of market sentiment.
Secondly, the long bullish candlestick preceding the bearish candlestick indicates that there was initially a bullish sentiment in the market. It adds to the reliability of the pattern as a reversal signal, as the second bearish candlestick suggests that the bearish momentum is strong enough to overcome the previously bullish sentiment.
On its own, the bearish kicker candlestick might not be so reliable as there are many possibilities that you might find them almost anywhere on the chart. Combined with important confluence like volumes and multi-timeframe confirmation, they can be very effective, producing breath-taking profits in no time.
What Should Traders Consider Before Entering A Trade Based On A Bearish Kicker Candlestick Pattern?
The odds of having a bearish kicker candlestick right is flat-out small. Still, you could improve your chances of profitability by adding considering the following before entering a trade based on a bearish kicker candlestick pattern:
Confirmation: Traders should ensure that a subsequent bearish candlestick pattern confirms the bearish kicker pattern.
TREND: Traders should ensure that the market is downtrend before entering a bearish trade.
VOLUME: Traders should pay attention to the volume of the bearish kicker candlestick, as a high volume could indicate a strong bearish sentiment.
SUPPORT AND RESISTANCE LEVELS: Traders should consider the location of any support and resistance levels in the market, as the bearish kicker pattern could potentially break through these levels.
RISK MANAGEMENT: Traders should have a clear risk management strategy, as bearish trades can be risky.
MULTI-TIMEFRAME CONFIRMATION: Amongst so many profitability hacks, the multiple-timeframe confirmation has proven to be quite helpful and most significantly effective because it helps you make a lower time frame decision based on the hand that is played by the higher timeframe.
In summary, traders should consider confirmation, trend, volume, support and resistance levels, and risk management before entering a trade based on a bearish kicker candlestick pattern.
How Often Does The Bearish Kicker Candlestick Pattern Appear In The Market?
The bearish kicker candlestick pattern is a rare occurrence in the market. It typically appears during times of high volatility, signaling a potential reversal in the market trend. It is not a common occurrence and may only occur a few times a year or even less frequently. Therefore, traders should be aware of this pattern but not rely on it as a frequent trading signal.
What Trading Strategy Is Best Suited For A Bearish Kicker Candlestick Pattern?
The best trading strategy for a bearish kicker candlestick pattern is to sell short or use a short put option. These strategies allow the trader to profit from the downward trend by selling the asset at a higher price and repurchasing it at a lower price.
It is important to note that a bearish kicker candlestick pattern is not a guarantee of a downward trend and should be used in conjunction with other technical analysis tools and market conditions to make informed trading decisions.
What Are The Advantages And Disadvantages Of Using A Bearish Kicker Candlestick Pattern To Trade?
One advantage of the bearish kicker pattern is that it can strongly indicate a trend reversal. The large bullish candle that follows the bearish candle is a clear sign that buyers are taking control of the market, which can be an excellent opportunity to enter a long position. This pattern can also be used to identify potential support levels, as the sizable bullish candle may indicate that the price has found support and is likely to continue rising.
The bearish kicker candlestick pattern is a powerful reversal signal that occurs when a large bullish candle follows a bearish candle. This pattern indicates a potential change in trend from bearish to bullish, and traders can use it to enter long positions. However, using this pattern for trading also has some potential drawbacks.
However, there are also some potential disadvantages to using this pattern. One of the main drawbacks is that it is unreliable, as it can be prone to false signals. The bearish kicker pattern can also be challenging to identify in real time, as it requires traders to pay close attention to the market and be able to recognize the pattern as it forms quickly. Additionally, this pattern may be less effective in volatile markets, as the large swings in price can create false signals.
The bearish kicker candlestick pattern can be a valuable tool for traders looking to enter long positions, but it is essential to keep in mind its potential limitations. As with any trading strategy, it is necessary to use the pattern in conjunction with other technical and fundamental analysis techniques to make informed trading decisions.
What Is Risk Management Required When Trading With A Bearish Kicker Candlestick Pattern?
When trading with a bearish kicker candlestick pattern, it is crucial to implement risk management strategies to mitigate potential losses. This can include setting stop-loss orders at predetermined price points, diversifying your portfolio, and limiting the amount of capital invested in a single trade.
Additionally, it is advisable to closely monitor market conditions and keep up to date on any news or events that may impact the security being traded. By taking these precautions, traders can minimize their risk exposure and protect their investments in the event of market downturns.
How Can Traders Protect Themselves From False Signals Generated By A Bearish Kicker Candlestick Pattern?
Traders can protect themselves from false signals generated by a bearish kicker candlestick pattern by:
Using Other Technical Analysis Indicators To Confirm The Pattern
While the bearish kicker pattern may indicate a potential trend reversal, it is vital to use other indicators, such as moving averages, trend lines, and oscillators, to confirm the signal. However, because of the few trades you’ll get even fewer if you include additional trading indicators.
Waiting For The Pattern To Be Confirmed
It is essential to wait for the pattern to be confirmed by subsequent price action rather than blindly following the signal.
Using A Stop Loss
Setting a stop loss can help protect traders from false signals by limiting their potential losses.
Using A Risk Management Plan
Implementing a risk management plan and adhering to it can help traders avoid making impulsive decisions based on false signals.
Trading with a disciplined approach
Discipline and patience are essential when it comes to avoiding false signals. Traders should have a clear trading plan and stick to it rather than getting swayed by emotions or seeking instant gratification.
Trade many candlestick patterns
You should also trade many more candlestick patterns, not to mention other types of trading strategies. Th best risk management is strategy diversification!
How Is The Bearish Kicker Candlestick Pattern Different From Other Candlestick Patterns?
While the bearish kicker candlestick might compare to other candlestick patterns in more than one way, there’s a fine line that tells the difference between this candle stick and different existing candlestick patterns, including:
- A two-momentum candlestick
and
- Market gap
The bearish kicker candlestick consists of a large bearish candle followed by a small bullish candle, whereas other candlestick patterns may have more complex formations. This pattern is considered a strong reversal signal as it indicates a sudden shift in sentiment and can be used to enter a short position.
Are There Any Seasonal Or Market Conditions That Favor A Bearish Kicker Candlestick Pattern?
The bearish kicker candlestick pattern is a bearish reversal pattern that typically appears at the top of an uptrend, and is thus not related to any seasonal pattern, although it might help. It is composed of two candlesticks: the first is a tall bullish candle, and the second is a bearish candle with a gap down from the first candle’s high.
This pattern suggests that the bulls are losing control and the bears are taking over, potentially leading to a downtrend. Some market conditions that may favor the use of a bearish kicker candlestick pattern include a market that is overbought, a market with high levels of bullish sentiment, or a market that is experiencing a top or resistance level.
How Does A Bearish Kicker Candlestick Pattern Compare To Other Trading Indicators?
The bearish kicker candlestick pattern differs to other trading indicators because it is outrightly based solely on price action. And like any other price action, it helps you determine or predict the potential move or flow of momentum, volume, and bias in a financial instrument.
Compared to other trading indicators, a bearish kicker candlestick pattern may be more reliable in predicting trend reversals, as it reflects the actual buying and selling activity of market participants. However, it is essential to consider multiple indicators and factors when making trading decisions.
What Technical Analysis is Best Used With a Bearish Kicker Candlestick Pattern?
The best technical analysis to use with a bearish kicker candlestick pattern is trend analysis. It involves looking at the market’s overall trend and identifying any downward movements or weaknesses. Other techniques, such as support and resistance analysis and momentum indicators, may also help analyze the strength of the bearish trend.
How Can Traders Improve Their Understanding Of A Bearish Kicker Candlestick Pattern?
You can improve your understanding of a bearish kicker candlestick pattern by studying its characteristics and analyzing its behavior in different market conditions.
They can also compare it to other bearish patterns and observe how it performs with these patterns. In addition, traders can practice identifying and interpreting bearish kicker patterns through simulated trading or by analyzing historical price data. It is also helpful for traders to seek the guidance of experienced traders or educators to gain a deeper understanding of this pattern.
What Are The Most Important Factors To Consider When Trading With A Bearish Kicker Candlestick Pattern?
The most important factors to consider when trading with a bearish kicker candlestick pattern are the market trend, the strength of the bearish signal, and the presence of supporting technical indicators. It is also essential to consider the volume and liquidity of the security, as well as any relevant news or economic events that may affect the price.
What is The Best Way To Combine A Bearish Kicker Candlestick Pattern With Other Trading Strategies?
The best way to combine a bearish kicker candlestick pattern with other trading strategies is to ensure it adds diversification and is complementary. Adding more confluence to a candlestick pattern that could never go out of style. If anything, it increases efficiency and your odds of being profitable.
There are generally lots of confluences or other trading strategies you could combine with your bearish kicker candlestick pattern to improve the odds of being right.
The trend is one of the best trading strategies you can include in your toolbox. The market trend helps you determine the general flow of momentum and volume price action. Combined with a bearish kicker candlestick, you can expect better precision and result in determining potential shorting opportunities in the market as they arise.
The multi-time frame analysis is also a crucial trading strategy; it helps you see the bigger picture and understand the market structures as they appear in every stock or financial instrument.
How Does The Bearish Kicker Candlestick Pattern Interact With Different Types Of Support And Resistance Levels?
The bearish kicker candlestick pattern interacts well with support and resistance. All candlestick patterns, including the bearish kicker candle always displays better potential and is increasingly more reliable when interpreted based on where they appear on the chart. These candlestick interests are unique to different types of support and resistance levels. For example, a bearish kicker candle that appears in a daily time frame support level would be much more reliable than a bearish kicker candle that appears on a 30 minutes candlestick.
How Does The Bearish Kicker Candlestick Pattern Indicate Potential Trend Reversals?
The bearish kicker candlestick pattern indicate a potential trend reversal because the first candle is a long bullish candle followed by a bearish candle that opens above the high of the white candle and closes at or below its midpoint. This pattern indicates that the bulls are losing control and the bears are taking over, potentially leading to a downtrend. It is important to note that the bearish kicker pattern is most reliable when it occurs after an uptrend and at a critical resistance level.
What Are The Best Methods To Determine The Entry And Exit Points With A Bearish Kicker Candlestick Pattern?
The best methods to determine the entry and exit points with a bearish kicker candlestick pattern are to use technical analysis tools such as moving averages, trend lines, and support and resistance levels, as well as considering market sentiment and news events. It is also essential to set stop-loss orders to minimize potential losses.
How Should Traders Adjust Their Trading Strategies When The Bearish Kicker Candlestick Pattern Fails To Produce Reliable Signals?
Traders should consider adjusting their trading strategies to minimize potential losses when the bearish kicker candlestick pattern fails to produce reliable signals.
One option is to wait for the pattern to confirm itself before making a trade, which will help ensure that the signal is more reliable. Alternatively, traders can consider using other technical analysis tools, such as trend lines or support and resistance levels, to confirm the bearish trend.
Additionally, traders may consider using stop-loss orders to protect their positions if the bearish trend does not materialize. Ultimately, the key is to remain flexible and open to making adjustments to maximize profits and minimize risks.
What is the success rate for the bearish kicker candlestick pattern?
The success rate for the bearish kicker candlestick pattern is only 47%, according to our candlestick study. Thus, this is not a particularly reliable pattern.
How often does the bearish kicker candlestick pattern happen?
The bearish kicker candlestick pattern does not happen often. Since 1993 until today, it has only been 19 bearish kicker in the S&P 500 stock index.
How reliable is the bearish kicker candlestick pattern?
The bearish kicker is an unreliable candle stick pattern with only a 47% success rate. Hence its name “bearish.”
How accurate is the bearish kicker candlestick pattern?
The bearish kicker candlestick pattern is not particularly accurate with only a 47% accuracy.
Is the bearish kicker candlestick pattern profitable?
The bearish kicker is not a profitable candlestick pattern. Since 1993, it has returned a negative average return per trade of 0.47%, hence its name “bearish”.
Is the bearish kicker candlestick pattern bullish or bearish?
The bearish kicker is a bearish candlestick pattern. Many patterns named “bearish” turn out to be bullish in backtest and practice, but the bearish kicker is not one of them. You can expect a negative return if you buy a bearish kicker pattern.
What is the win rate for the bearish kicker candlestick pattern?
The win rate for the bearish kicker candlestick pattern is 47% based on our numbers and statistics for S&P 500. For example, the numbers might be different if you trade other markets, like gold or bonds.
What is the failure rate for the bearish kicker candlestick pattern?
The failure rate for the bearish candlestick pattern is around 53% based on our studies and data-driven analysis. However, it’s in candlestick books regarded as a bearish pattern, and this seems like a correct observation for backtests done on the S&P 500. That said, the results might be different for other markets.
FAQ:
What is the bearish kicker candlestick pattern, and how does it work?
The bearish kicker candlestick pattern is a powerful bearish reversal pattern characterized by a large, downward-moving candle following an uptrend. It signals a shift from bullish to bearish sentiment. Traders often use it to identify potential selling opportunities and anticipate a change in price direction.
Is the bearish kicker candlestick pattern a reliable reversal signal?
The reliability of the bearish kicker pattern as a reversal signal depends on various factors. The significant downward gap between the two candlesticks suggests a strong shift in momentum. However, it’s essential to confirm the pattern with additional indicators and factors, such as high trading volume and multi-timeframe confirmation.
How does the bearish kicker candlestick pattern interact with different types of support and resistance levels?
The effectiveness of the bearish kicker pattern can be influenced by its interaction with different types of support and resistance levels. For example, the pattern may be more reliable when it occurs at a daily timeframe support level compared to a shorter timeframe. Traders should consider the context in which the pattern appears.