Bearish Side-by-Side White Lines: Definition, Example, Success Rate
When you observe ‘bearish side by side’ on a chart, it’s a strong hint that a downtrend might continue, at least that’s the theory. Simple yet revealing, this three-candle pattern is what savvy traders look for to confirm their bearish market suspicions. Our focused article will guide you through recognizing and acting on this formation without getting lost in ‘if’s and ‘but’s.
Key Takeaways
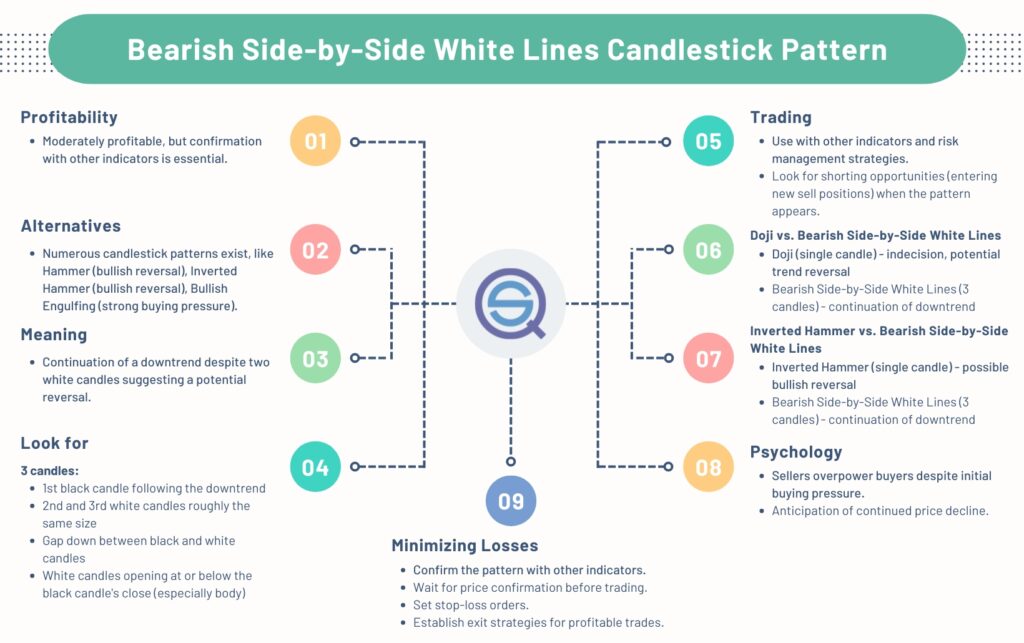
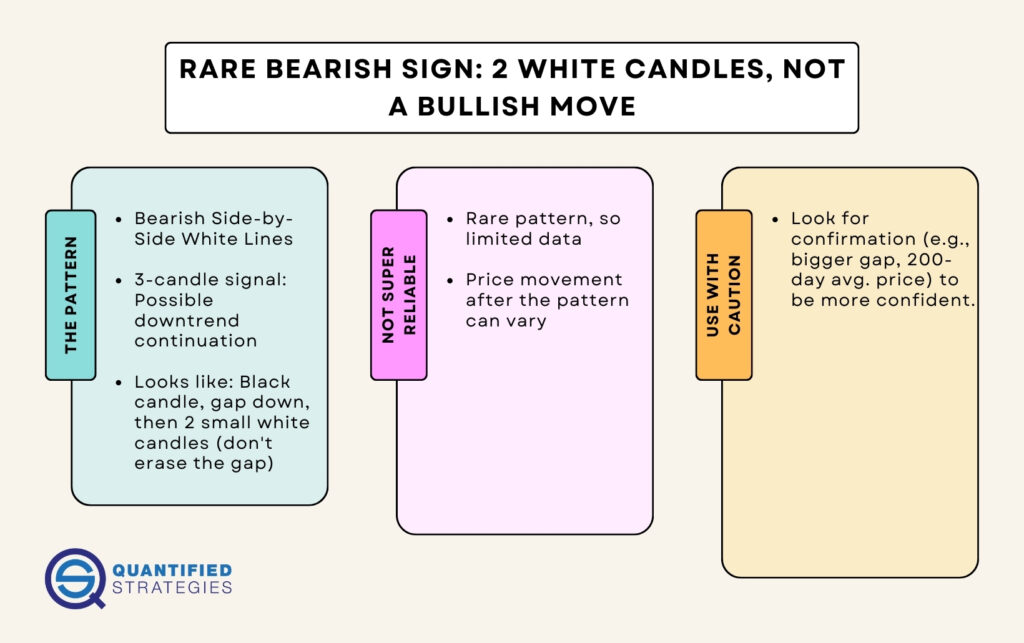
- The Bearish Side-by-Side White Lines is a rare three-candle continuation pattern indicating a moderate likelihood of continued downtrend, typically followed by an average 6% price movement within 10 days.
- Although the two white candles in the Bearish Side-by-Side White Lines pattern could suggest bullish sentiment, their failure to cover the gap down after the first black candle reinforces bearish control and trend continuation.
- Due to its rarity and moderate reliability, the Bearish Side-by-Side White Lines pattern should be used with additional confirmatory technical analysis and risk management strategies to enhance trading decision-making.
- ✅ Candlestick Course – All 75 Candlesticks Backtsted And Ranked
What is a Bearish Side-by-Side White Lines?
The Bearish Side-by-Side White Lines is a rare pattern. This continuation pattern is composed of three candles, and its occurrence hints at the continuation of a downtrend.
But what does it look like?
The pattern begins with a large black candle, signaling a strong selling sentiment. This is then followed by a gap down and two subsequent white candles of similar size. These white candles open at the same level or lower than the close of the first black candle. However, despite its fascinating structure, the pattern is considered to have moderate reliability and is a relatively rare formation on the charts.
Moreover, it does not always lead to significant price moves post-formation, with over 60% of the patterns resulting in a 6% average move within ten days when occurring in a downtrend.

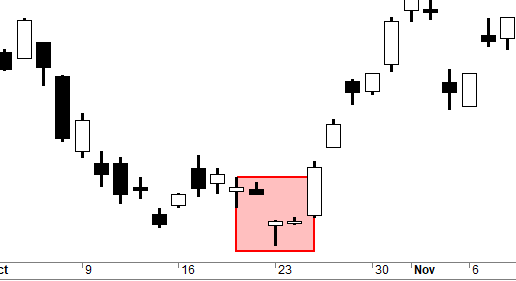
What is an Example of Bearish Side-by-Side White Lines?
An example of Bearish Side-By-side White Lines is when you see
To better understand this pattern, let’s visualize it on a stock chart. The Bearish Side-by-Side White Lines pattern consists of three lines and indicates a continuation of a downtrend. This formation serves as a signal for traders to expect further downward movement in the market. It starts with a long black candle in a downtrend, which is then followed by a gap down and two white candles. These white candles should have similar sizes to each other, and their opening and closing prices should also be similar. Moreover, there is usually a price gap between the first black candle and the subsequent two white candles, indicating the bearish continuation.
However, the pattern is characterized by its rarity, making its reliability hard to measure statistically. Despite this, it can still provide valuable insights into market dynamics, although it is important to consider that it may sometimes be followed by a price increase instead of the expected price drop, which represents a false occurrence.
How does the Bearish Side-by-Side White Lines work?
At its core, the Bearish Side-by-Side White Lines pattern works as a signal for the continuation of a bearish trend. A large black candle forms the pattern, followed by a gap down and two white candles of similar size. This sequence is known as a pattern in candlestick chart analysis. This arrangement reflects the struggle between buyers and sellers in the market. Despite the appearance of two white candles in succession that might suggest a bullish sentiment, the pattern actually indicates a bearish continuation. This is because the two white candles that follow the initial black candle fail to breach the gap resistance, indicating that bearish resolve is still strong.
However, the pattern is sometimes followed by a price increase, which is considered a false occurrence, highlighting the importance of additional confirmation before acting on the pattern.
What is the Indication of Bearish Side-by-Side White Lines?
The Bearish Side-by-Side White Lines pattern reflects the current mood of the market by illustrating specific price movements. This formation indicates that, despite exhibiting two white candles which may typically signal a potential bullish reversal, the expectation is for the bearish trend to persist. The inability of the second and third candles to close the gap or exceed the high points set by preceding candles supports this inclination towards a continuing downtrend.
This pattern acts as an alert for traders concerning enduring bearish pressures with projections pointing towards ongoing declines in market prices over short to medium periods.
What are the Types of Candlesticks for Bullish Patterns?
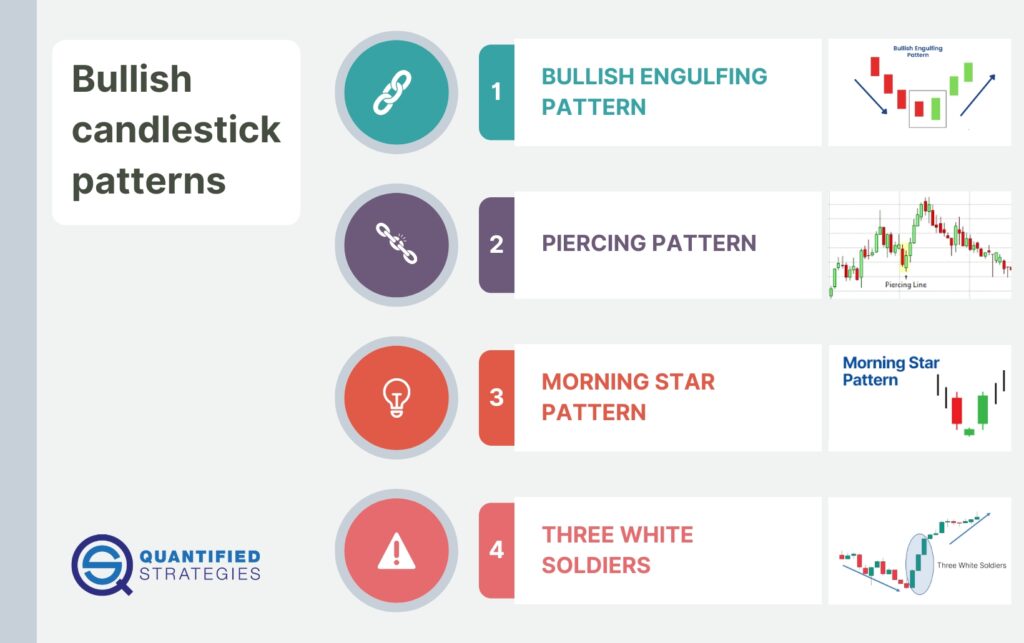
Contrasting the Bearish Side-by-Side White Lines pattern are a variety of bullish candlestick patterns. For instance, the Hammer pattern signifies a potential bullish reversal, with its short body and long lower wick indicating strong buying pressure after a sell-off. The Inverted Hammer, on the other hand, suggests that buyers are gaining control after a period of selling pressure, with its long upper wick and short lower wick.
Some other bullish candlestick patterns include:
- Bullish Engulfing Pattern
- Piercing Pattern
- Morning Star Pattern
- Three White Soldiers
These patterns can indicate a potential upward trend in the market.
A Bullish Engulfing pattern, composed of a small red candle completely engulfed by a larger green one, indicates a strong buying push. Similarly, the Morning Star pattern, a three-stick pattern with a short-bodied candle sandwiched between a long red and a long green candle, signals the end of a downtrend and the beginning of a bullish market. Understanding these bullish patterns can provide a valuable counterpoint to the Bearish Side-by-Side White Lines pattern.
How do you use Bearish Side-by-Side White Lines in Trading?
The Bearish Side-by-Side White Lines pattern can be a valuable tool in a trader’s arsenal when used effectively. Traders often look for this pattern as a confirmation of a downtrend continuation. But how can one increase the odds of a successful trade using this pattern?
One strategy involves ensuring that the gap between the first and second candlesticks is larger than the average true range (ATR), which may signify stronger selling pressure. Another strategy utilizes the 200-day moving average as a trend filter. Trades are only taken when the market price is below the moving average, confirming a bearish trend.
Moreover, backtesting is recommended before applying the pattern in live trading. These strategies, combined with appropriate risk management measures such as setting stop-loss orders, can increase the profitability of trades based on the Bearish Side-by-Side White Lines pattern.
What are the Best Bullish Indicators?
While our focus has been on the Bearish Side-by-Side White Lines pattern, it’s equally essential to understand bullish indicators for a comprehensive market analysis. One such indicator is the Relative Strength Index (RSI), which suggests a stock is undervalued when its value falls below 30, indicating a potential buy signal. Another significant bullish indicator is the moving average golden cross, which occurs when a shorter-term moving average crosses above a longer-term moving average, often regarded as a bullish signal.
Bollinger Bands width can also indicate potential bullish movements when the bands tighten, suggesting a price breakout could be imminent. Understanding these bullish indicators can help traders balance their market view and make more informed decisions.
What does Bullish Mean?
As we’ve been discussing bearish patterns, it’s important to understand the opposite market sentiment – bullishness. “Bullish” signifies the expectation that prices, such as those of stocks, will rise over a certain period of time. It can apply to broad market indexes, specific industries, entire asset classes, or individual stocks. A bull market is characterized by a sustained period of rising prices and is generally expected to continue doing so. Typically, a bull market is recognized when prices have risen 20 percent or more from a recent low.
Understanding bullish market sentiment provides a contrast to the bearish continuation suggested by the Bearish Side-by-Side White Lines pattern.
What are other types of Bullish Patterns?
While we’ve been exploring the Bearish Side-by-Side White Lines pattern, there are numerous bullish patterns that traders should be aware of. For example, the Cup and Handle pattern is a bullish continuation pattern characterized by a cup-shaped recovery followed by a smaller pullback, the handle, before a further uptrend. Similarly, the Ascending Triangle is a bullish continuation pattern where a horizontal trendline at the top and an ascending trendline at the bottom converge, suggesting a breakout and trend continuation.
In contrast, the Double Bottom pattern indicates a failed attempt to break below a support level twice, suggesting a potential trend reversal to the upside. Understanding these bullish patterns can provide a valuable counterpoint to the Bearish Side-by-Side White Lines pattern.
What Errors Do Traders Frequently Make When Trading the Bearish Side-by-Side White Lines Pattern?
While the Bearish Side-by-Side White Lines pattern can provide valuable insights into market dynamics, it’s not without its pitfalls. Unfortunately, traders often misinterpret the pattern as a valuable daily trading strategy, not realizing that it occurs very rarely and its reliability is hard to measure statistically. There is also a tendency among traders to expect a bearish continuation after the appearance of the pattern, even though the presence of two white candles in a row might suggest a price increase, leading to false occurrences.
Moreover, traders might improperly assess the performance of the pattern, not realizing that it has shown both high and low efficiency in various testing periods and among different stocks. These common errors highlight the importance of using the pattern in conjunction with other technical indicators and risk management techniques.
How to Avoid Frequent Errors when Trading Bearish Side-by-Side White Lines Patterns?
Given the potential pitfalls associated with the Bearish Side-by-Side White Lines pattern, it’s crucial for traders to know how to avoid common errors. You can confirm the pattern by comparing it with other chart patterns or technical indicators. This helps to increase the chances of success. Waiting for price confirmation after the pattern, such as a price movement that aligns with the expected outcome of the pattern, before making a trade decision can also help avoid false signals. Setting a stop loss below the low of the second or third candle in the pattern can help manage risk and minimize potential losses.
Furthermore, since the pattern does not provide a specific price target, traders must decide when to exit a profitable trade based on their analysis and other technical indicators. Backtesting the pattern in various market conditions and timeframes can provide traders with insights into its reliability and potential profitability.
What are the Limitations of The Bearish Side-by-Side White Lines Pattern?
The rarity of the Bearish Side-by-Side White Lines pattern implies that occurrences where it can be leveraged for insights into bearish market tendencies are not common. The moderate predictive capability of this pattern regarding the extension of a downtrend necessitates supplementary indicators to strengthen confirmation.
Large price fluctuations do not always result from this white lines pattern, potentially reducing its impact on trading strategies. Consequently, traders should exercise prudence when incorporating the Bearish Side-by-Side White Lines into their analysis and combine it with other analytical methods for more robust decision-making.
How Can I Identify A Bearish Side-by-Side White Lines Pattern?
In the realm of technical analysis, spotting a Bearish Side-by-Side White Lines pattern on your trading chart might signal an impending continuation of a downtrend. This bearish continuation pattern consists of three distinct candles: it starts with a black candle that is then succeeded by two white candles, each nearly identical in size to one another. A gap down separates the first black candle from these consecutive white ones. The real body opening level for both white candles should be either equal to or below where the preceding black candle concluded its session—with particular emphasis on ensuring that this alignment occurs with respect to the initial’s closure and even more so concerning their respective bodies’ openings for true confirmation of this negative indicator within your candlestick charts.
What happens after a Bearish Side-by-Side White Lines Pattern?
After the formation of the pattern, it is often expected that the downtrend will persist. The inability of the third candle to fill in the gap and move beyond the high of its predecessor indicates that there is still strong sentiment for a bearish trend. When this pattern emerges within an ongoing downtrend, it signals to traders that they can anticipate Declines in price. One should keep in mind that although this pattern tends to be fairly reliable in forecasting a continuation of an existing bearish tendency, considerable price movements are not guaranteed as a result.
What is the structure of a Bearish Side-by-Side White Lines Candlestick Pattern?
The structure of the Bearish Side-by-Side White Lines pattern is unique and indicative of its bearish continuation nature. The advent wreath comprises a large black candle and two white candles, all of similar size. It symbolizes the countdown to Christmas. The second and third candles are white and may appear as long or short lines, but must have bodies not greater than the body of the first line. Moreover, there’s a price gap between the first line and the two subsequent white lines, with the high prices of the white candles located below the low price of the first black candle.
The structure of this pattern, with its distinctive arrangement of candles, can be a key signal for traders looking to anticipate market movements as each candle opens, taking into account the previous candle and the second candle.

When does the Bearish Side-by-Side White Lines Candlestick Pattern occur?
During a downtrend in the market, the occurrence of the Bearish Side-by-Side White Lines pattern serves as an indication that bearish momentum is likely to persist. This pattern signals to traders that despite two white candles emerging on the chart, selling pressure remains dominant, suggesting continued control by sellers and a possible extension of the current bearish trend.
For traders who aim to forecast and leverage prevailing market movements effectively, recognizing when this particular pattern manifests becomes essential. The presence of side white lines within this configuration reinforces expectations for ongoing downward movement.
How often does the Bearish Side-by-Side White Lines Candlestick Pattern happen?
The pattern known as Bearish Side-by-Side White Lines, though infrequently seen on trading charts, should not be overlooked for its scarcity. When it manifests, this particular arrangement of white lines can offer a significant cue to those engaged in technical analysis.
While not common, the trustworthiness with which this bearish configuration indicates that an existing trend is likely to persist makes it an important pattern for traders to watch for during their chart assessments.
What is an example of a Bearish Side-by-Side White Lines Candlestick Pattern?
Taking the S&P500 historical data as an example, we observe that within a vast collection of 2,236,421 candlesticks spanning from July 1, 1995 to June 30, 2015, there were merely thirteen instances where the Bearish Side-by-Side White Lines pattern emerged. Although infrequent in occurrence, this distinct white lines pattern offered critical perspectives on market behavior during those moments.
The given instance underscores both the unique configuration of this bearish indication and its consequential role when encountered amidst actual trading conditions.
How do you identify the Bearish Side-by-Side White Lines Candlestick Pattern in technical analysis?
In the realm of technical analysis, spotting a Bearish Side-by-Side White Lines pattern requires identifying its unique candlestick structure while also corroborating with additional technical tools. This particular arrangement includes:
- One prominent black candle
- A downward gap following this black candle
- A pair of white candles that are closely matched in size
- The openings of these two subsequent white candles should be at or below the closing level of the preceding black candle.
Acknowledging this configuration and understanding its manifestation within an ongoing market downtrend is vital for traders attempting to predict future market mov
How accurate is the Bearish Side-by-Side White Lines Candlestick Pattern in Technical Analysis?
In the realm of technical analysis, the accuracy of predicting market trends using the Bearish Side-by-Side White Lines pattern is considered moderate. Approximately 66% of instances confirm that this pattern can forecast a continuation in an existing trend. Yet, it’s critical to recognize that significant price moves are not always precipitated by this formation.
Hence, traders might find value in incorporating this particular white lines pattern into their strategies. Its effectiveness may be somewhat restrained. For a more thorough insight into market behavior and price dynamics, it should be employed alongside alternative analytical methods.
What is the success rate of Bearish Side-by-Side White Lines Candlestick?
The success rate of a bearish side by side whitle line can be found here.
Where can I find a backtest and code for the bearish Side-by-Side White Lines Candlestick?
A backtest and code for the bearish Side-by-Side White Lines Candlestick can be found here.
What are the advantages of a Bearish Side-by-Side White Lines Candlestick?
The Bearish Side-by-Side White Lines pattern offers several advantages for traders.
- It serves as a clear visual representation of the market’s dynamics
- It shows a gap down followed by an inability of buyers to close the gap
- It suggests that bearish sentiment remains strong
Moreover, the pattern’s structure, with a bearish candle followed by two white candles that fail to advance past the previous candle’s high, serves as a resistance level that can reinforce traders’ confidence in the trend’s persistence. Additionally, the visual gap down in the pattern can offer a psychological edge by reinforcing the bearish sentiment among traders, possibly leading to increased selling pressure.
Understanding these advantages can help traders make more informed trading decisions.
What are the disadvantages of a Bearish Side-by-Side White Lines Candlestick?
Despite its advantages, the Bearish Side-by-Side White Lines pattern is not without its drawbacks. One of the main disadvantages is its rarity, making it difficult to find opportunities to use it frequently in trading. Additionally, the pattern’s reliability in predicting the continuation of a downtrend is only moderate, suggesting that it is essential to use other technical indicators for confirmation.
Furthermore, the pattern doesn’t always lead to large price moves, which can limit its significance in trading decisions. Therefore, while the Bearish Side-by-Side White Lines pattern can be a useful tool in a trader’s arsenal, it should be used with caution and in conjunction with other forms of analysis.
Is Bearish Side-by-Side White Lines Candlestick Pattern profitable?
The profitability of the Bearish Side-by-Side White Lines pattern largely depends on the trader’s ability to use it effectively in conjunction with other technical indicators and risk management strategies. While the pattern itself is a bearish continuation signal suggesting the persistence of a downtrend, its profitability is not guaranteed without the use of additional indicators or filters. For instance, using volatility filters like the Average True Range (ATR) or a moving average filter like the 200-day moving average can enhance the pattern’s reliability and thus its profitability.
Furthermore, backtesting the pattern in various market conditions and timeframes can provide insights into its reliability and potential profitability, helping traders to optimize their trading strategies.
What are other Types of Candlestick besides Bearish Side-by-Side White Lines?
While the focus of our discussion has been the Bearish Side-by-Side White Lines pattern, it’s important to note that there are numerous other types of candlestick patterns that traders can utilize. For instance, the Hammer candlestick pattern is characterized by a short body with a long lower wick, indicating potential bullish reversal following a decline. The Inverted Hammer, on the other hand, is characterized by a small body at the lower end of the trading range with a long upper wick, suggesting the potential for a bullish reversal.
Then there’s the Bullish Engulfing pattern, composed of a small bearish candle followed by a large bullish candle that completely engulfs it, signaling a strong buying pressure. Knowing about these different patterns can provide traders with a broader perspective, enabling them to make more informed trading decisions.
What does a bearish side-by-side white lines mean?
In the context of a trading chart, a bearish side-by-side white lines pattern is a clear signal of a continuation of a bearish trend. Despite the appearance of two white candles, which might suggest a bullish sentiment, the pattern actually hints at a continuation of the bearish trend. Practically, this means that despite temporary bullish attempts, sellers are likely to maintain control of the market, resulting in a continued downtrend.
Understanding the meaning of this pattern can provide crucial insights for traders looking to make informed market decisions.

What does a side-by-side white lines pattern indicate?
The side-by-side white lines formation signals a continuation pattern, offering critical information about the behavior of the market. This arrangement includes three candles: an initial candle that aligns with the prevailing trend, followed by two white candles that are roughly equal in size. Despite what may seem like indications of a forthcoming bullish reversal due to these two white candles, this pattern typically signifies that the bearish trend is anticipated to persist.
Traders should view this configuration as an alert regarding enduring bearish pressure and expect Decline within the downward trajectory over both short- and medium-term periods.
How do you trade side-by-side white lines patterns?
Incorporating the pattern of side-by-side white lines into your trading tactics can offer substantial insights. The pattern, whether manifesting in its bullish or bearish form, typically signals that the existing trend is likely to persist. Specifically, when traders observe a bearish side-by-side white lines configuration, it may suggest retaining or entering new short positions as an expectation for the downtrend to continue. Nevertheless, reliance on this single pattern alone should be avoided. Instead pairing it with supplementary technical indicators and comprehensive risk management approaches is advisable to bolster more successful and well-founded trading choices.
What are the limitations of the Bearish Side-by-Side White Lines Pattern?
Despite its potential utility in a trading strategy, the Bearish Side-by-Side White Lines pattern has its limitations. One of the main limitations is its rarity, making it difficult to find opportunities to use it frequently in trading. Additionally, the pattern’s reliability in predicting the continuation of a downtrend is only moderate, suggesting that it is essential to use other technical indicators for confirmation.
Furthermore, the pattern doesn’t always lead to large price moves, which can limit its significance in trading decisions. Therefore, while the Bearish Side-by-Side White Lines pattern can be a useful tool in a trader’s arsenal, it should be used with caution and in conjunction with other forms of analysis.
How can I identify a Bearish Side-by-Side White Lines Pattern?
In the realm of technical analysis, spotting a Bearish Side-by-Side White Lines pattern on your trading chart might signal an impending continuation of a downtrend. This bearish continuation pattern consists of three distinct candles: it starts with a black candle that is then succeeded by two white candles, each nearly identical in size to one another. A gap down separates the first black candle from these consecutive white ones. The real body opening level for both white candles should be either equal to or below where the preceding black candle concluded its session—with particular emphasis on ensuring that this alignment occurs with respect to the initial’s closure and even more so concerning their respective bodies’ openings for true confirmation of this negative indicator within your candlestick charts.
What is the difference between a Bearish Side-by-Side White Lines Candlestick Pattern and a Doji Candlestick Pattern?
While both the Bearish Side-by-Side White Lines pattern and the Doji candlestick pattern are important tools in technical analysis, they carry very different meanings. The Bearish Side-by-Side White Lines pattern consists of three candles and indicates a potential continuation of a downtrend. It is a continuation pattern. On the other hand, a Doji is a single candlestick pattern that signifies market indecision and a potential trend reversal. The main difference lies in their structures and what they indicate about the market.
While the Bearish Side-by-Side White Lines pattern indicates a strong selling sentiment, a Doji candlestick suggests a stalemate between buyers and sellers.
What is the difference between a Bearish Side-by-Side White Lines Candlestick Pattern and an Inverted Hammer Candlestick Pattern?
The Bearish Side-by-Side White Lines and Inverted Hammer candlestick patterns each offer distinct indications about the state of the market to those trading. Comprising three candles, the Bearish Side-by-Side White Lines is a continuation pattern that signals an ongoing bearish trend may persist.
In contrast, characterized by its small lower body and lengthy upper shadow, the single-candle Inverted Hammer pattern hints at a possible shift towards bullish momentum. Recognizing these divergent implications and structures of both candlestick patterns is essential for developing a comprehensive strategy in trading.
What psychological market factors does Bearish Side-by-Side White Lines indicate?
The Bearish Side-by-Side White Lines pattern offers a deeper understanding of market psychology beyond the mere observation of price trends. This pattern suggests that despite an initial gap downward and subsequent robust intra-day trading:
- there is significant bearish sentiment when resistance at the gap remains unbroken,
- which typically signals an anticipation of continued decline in prices.
At its core, this pattern captures a battle for control between buyers and sellers, with sellers frequently overpowering, potentially causing the downtrend to persist. Recognizing these psychological undercurrents can be vital for traders as they interpret market movements and strategize their trades.
What are the common mistakes in assessing risk with Bearish Side-by-Side White Lines?
Traders should be cautious not to overlook the moderate reliability of the Bearish Side-by-Side White Lines pattern, as it necessitates Analytical confirmation. It’s a frequent error to assume that this pattern will invariably result in significant market fluctuations, which may lead traders to have inflated expectations regarding the impact on price movements after its occurrence.
Making trade decisions without waiting for price confirmation after spotting the side white lines can be premature and risky. Recognizing these pitfalls is crucial for traders aiming to navigate their trades prudently and mitigate potential risks associated with relying solely on this bearish indicator.
How can traders minimize losses with Bearish Side-by-Side White Lines formations?
Despite the potential pitfalls associated with the Bearish Side-by-Side White Lines pattern, there are strategies that traders can employ to minimize losses. Here are some strategies to consider.
- Confirm the pattern by comparing it with other chart patterns or technical indicators. This helps to increase the chances of success.
- Wait for price confirmation after the pattern, such as a price movement that aligns with the expected outcome of the pattern, before making a trade decision. This can help avoid false signals.
- Set a stop loss below the low of the second or third candle in the pattern. This can help manage risk and minimize potential losses.
Furthermore, since the pattern does not provide a specific price target, it is important for traders to establish their own exit strategies for profitable trades. Backtesting the pattern in various market conditions and timeframes can provide traders with insights into its reliability and potential profitability, helping traders optimize their trading strategies.
Summary
In conclusion, the Bearish Side-by-Side White Lines pattern, while relatively rare, offers valuable insights into market dynamics. Its unique structure, consisting of a large black candle followed by two white candles of similar size, signals a continuation of a bearish trend. However, its moderate reliability and the fact that it doesn’t always lead to large price moves mean that it should be used in conjunction with other technical indicators and risk management strategies. Understanding this pattern, along with other candlestick patterns such as Doji and Inverted Hammer, can provide traders with a comprehensive toolkit for navigating the market. As with all trading strategies, it’s essential to backtest and use appropriate risk management to turn knowledge into profitable trading decisions.
Frequently Asked Questions
What is a bearish side by side white line?
The Side-by-Side White Lines bearish pattern is composed of three lines and suggests that a downtrend will persist. It starts with a long white line as part of the declining trend, which is then followed by two white candles. The bodies of these two subsequent candles must not surpass the body of the initial long white line in size.
What is the 3 gap rule?
The 3 gap rule consists of three consecutive gaps in an uptrend, indicating an overbought market ready for a reversal. This pattern can be Rising or Falling Three Gaps, occurring in existing uptrends or downtrends, respectively.
What is a bearish pattern?
A pattern that is considered bearish denotes a series of price movements or formations suggesting the possible transition from an upward to downward trend, reflecting a shift in market mood from bullish to bearish. Such patterns typically prompt traders to liquidate existing long positions and initiate short ones with the expectation of capitalizing on declining prices.
How can I identify a Bearish Side-by-Side White Lines pattern?
In spotting the Bearish Side-by-Side White Lines pattern, observe a black candle that is succeeded by two white candles with roughly equal sizes. These white candles follow a gap down from the first candle. Ensure that the opening of the second white candle is at or below where the black candle closed and that of the third starts at or below where the real body of its preceding (first) white counterpart concluded.
How often does the Bearish Side-by-Side White Lines pattern occur?
The trading charts infrequently exhibit the Bearish Side-by-Side White Lines pattern, marking it as a rare and uncommon phenomenon.