Bullish Separating Lines: Candlestick Pattern
Candlestick Patterns have become some of the most popular tools when it comes to analyzing the movements of a market. One candlestick pattern is the bullish separating lines.
Key Takeaways
- Bullish separating lines indicate bullish trend continuation.
- Two-candle pattern: bearish then bullish candle.
- Second candle opens near previous candle open.
- Signals end of temporary pullback in uptrend.
- Higher volume strengthens bullish continuation signal.
- Larger candle ranges confirm stronger bullish momentum.
- Seasonality factors may improve pattern reliability.
- Backtesting essential before using pattern in trading.
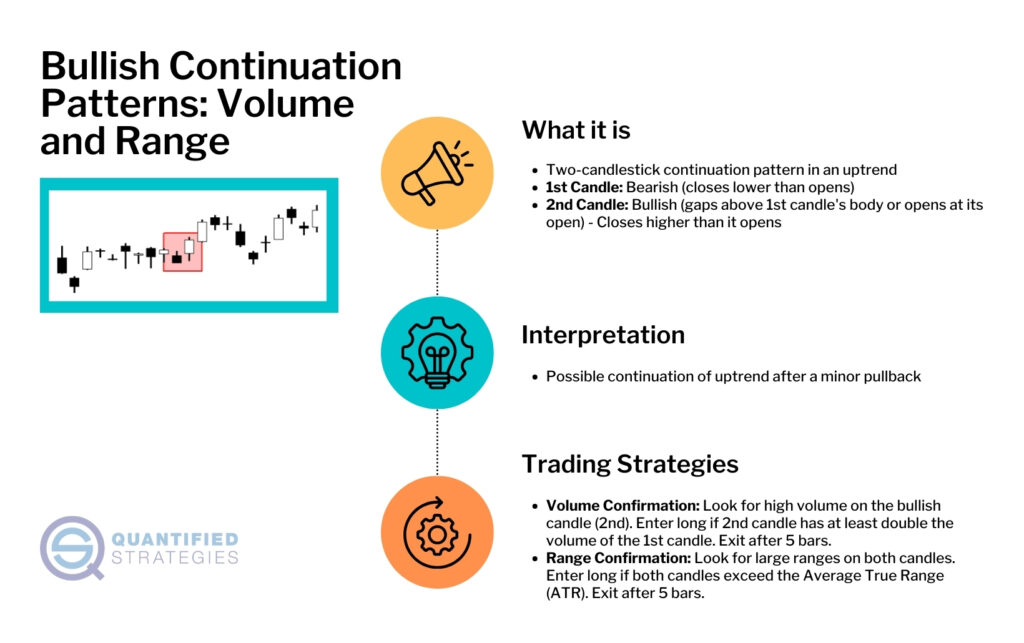
Bullish separating lines is a two candle bullish continuation candlestick pattern that forms in the middle of a bullish trend. It signals that the current bullish trend is about to continue after a temporary pullback.
This guide to the bullish separating lines will teach you everything you need to know about the pattern. We’ll cover its definition, meaning and how you can improve the pattern, together with some example trading strategies.
Let’s begin
Bullish Separating Lines Definition
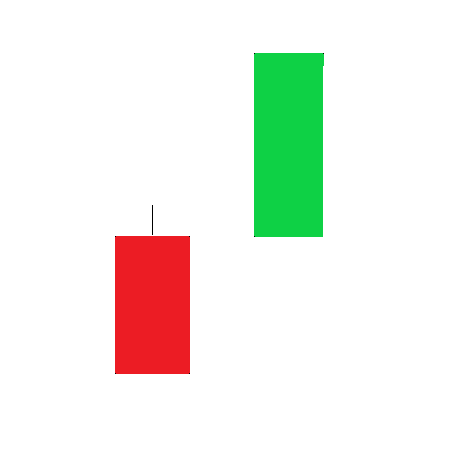
The bullish separating lines pattern consists of two candles, with the first being bearish and the second bullish. Here is the exact definition:
- The first candle is bearish.
- The second candle gaps above the body of the previous candle, or opens right at its open.
- The second candle closes higher than it opened.
The most common interpretation is that a bullish separating lines signals that the current bullish trend is about to continue, following a small pullback.
What Does a Bullish Separating Lines Tell Us About the Market?
As with every candlestick pattern, the bullish separating lines tells us a lot about the forces that formed the market action. And as traders, this is something that we’re very interested in!
Let’s have a look at what the bullish separating lines tells us about the market!
The market is in a bullish trend, and while it seems strong, we begin to see some signs of abating bullish strength. As bulls lose grip of the market, sellers take the opportunity to push the market lower.
However, as most market participants are aware of, pullbacks are natural parts of any trend, which makes a lot of people stand ready to get into the market as soon as it shows some signs of strength.
As the market suddenly gaps up and opens around the open of the previous candle, we get a sudden but effective signal that the bullish trend is going to continue. With most market participants waiting for this signal, a flood of buy orders hit the market, which in itself ensures the continuation of the bullish trend.
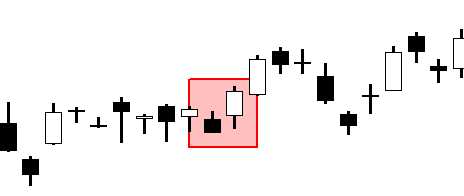
Bullish Separating Lines Example
Here follows an example of the pattern:

How to Trade the Bullish Separating Lines
Many traders believe that if they just read enough about different patterns, they’ll be able to trade profitably with once.
However, what most traders will realize with time, is that candlestick patterns aren’t enough on their own to take a trade. It’s essential that you add other types of technical analysis to support your observation and prediction of where prices are headed. In addition, you’ll have to ensure that you apply the pattern to a market and timeframe where it makes sense, which is best discovered with backtesting.
Having said this, we want to show you some of the methods that have helped us tremendously in our own trading strategies.
Let’s have a look at them!
Seasonality
Many markets show seasonal or time-based tendencies, which we may take advantage of.
In short, it means that a market tends to be more bullish or bearish at certain times, on a recurring basis. For example, we could be talking about certain weekdays, days of the month, or even specific months that show strong seasonal tendencies.
Now, in the case of the bullish separating lines, we preferably want to use seasonality to confirm that the period following the pattern is likely to be bullish. Just to give an example, we would be more inclined to act on a bullish separating lines if it occurs in the middle of the month, in a market that tends to bullish during the last half of the month.
Here is what we typically look at with regards to seasonality:
- The day of week – Many markets perform differently depending on which day of the week it is. For example, some markets are extra bullish on Wednesdays.
- Part of the month- In some markets, you will find that a trading strategy may work much better or worse depending on which part of the month it is. We recommend that you split the month into two or three pieces, and see how the strategy fares on each piece.
- Time of day – Sometimes you will find that a trading strategy only works during the first or second half of the trading session.
Time Since Last Peak or Bottom
Sometimes you may want to know how long it was since the market performed a significant peak or bottom. In essence, you’re measuring how long the market has gone without advancing in any direction.
With the bullish separating lines, it may be logical to measure the distance from the last high, to get a sense of how long we’ve been in a pullback. Then you will have to see whether the bullish separating lines works better when it appears after a long or short pullback. Of course, this will vary a lot depending on the market, so be sure to use backtesting!
Bullish Separating Lines Trading Strategies
Now we have had a look at two potentially powerful ways to reduce the number of false signals with the bullish separating lines pattern. To continue on the theme of improving the pattern, we’ll now cover two trading strategies that make use of it.
The strategies below are great examples of how we would go about to try and build a trading strategy. However, while they certainly serve well as inspiration, they aren’t ready to be traded live!
Trading Strategy 1: Bullish Separating Lines With Volume Condition
Sometimes volume can be of great help in a trading strategy, since it helps us notice when the big players are entering or exiting the market.
Generally, a candle is considered more significant if it’s formed with high volume. And due to this, we’ll require that the second bullish bar was formed with at least twice the volume of the first bearish bar.
In other words, the conditions to go long are:
- There is a Bullish Separating Lines
- The second candle has at least double the volume of the first candle
To exit the trade, we’ll just wait for 5 bars.

Trading Strategy 2: Bullish Separating Lines and Range Condition
Another great way to measure the significance of a market move is with range. If a candle has a big range, is simply means that market forces managed to move the market quite a distance, which in itself signals strength.
Now, the bullish separating lines is quite a special pattern considering that it contains a gap that’s bigger than or equal to the first candle’s range. In other words, bulls have to push the market quite a bit if they are going to cover the whole distance of the first candle. As such, the pattern actually turns more bullish if the first bearish candle has a big range!
However, what’s bullish too, is if the second candle is big as well.
This is why we’ll require both candles to be bigger than the average true range.
So, the rules to go long become:
- There is a bullish separating lines
- Both candle’s ranges should be higher than the average true range.
And then we simply exit the trade after 5 bars.

Ending Words
Now that we have come to the end of the article, we would like to give one final piece of advice.
Be sure to validate everything before you trade it live. That way you will avoid trading a lot of things that don’t work at all.
Here you can find our Candlestick pattern archive with many articles covering the subject.
FAQ
How is the bullish separating lines pattern defined?
The pattern consists of a bearish first candle and a bullish second candle that gaps above the body of the previous candle. The second candle closes higher than it opened. This pattern suggests the resumption of the bullish trend.
How can seasonality analysis be used with the bullish separating lines pattern?
Seasonality analysis involves understanding market tendencies during specific times. For bullish separating lines, seasonality can confirm the likelihood of a bullish period following the pattern. Analyzing days of the week, parts of the month, and time of day can provide insights.
What trading strategies can be applied to the bullish separating lines pattern?
Two trading strategies include using a volume condition, where the second candle has at least double the volume of the first, and a range condition, where both candle ranges are higher than the average true range. Both strategies involve exiting the trade after a specified number of bars.