
Doji Candlestick Trading Strategy: Backtesting a Doji Pattern
The Doji Candlestick Trading Strategy is popular, and the Doji pattern is one of the most famous candlestick patterns. A doji candle pattern is a specific candlestick formation used in technical analysis to identify market indecision, where the open and close prices are nearly identical. Candlestick patterns have several “derivatives” and can be used together with other bars. There are at least 74 different candlestick patterns that have been given a name, please read our article about how many candlestick patterns are there?
What is the doji pattern? Can we develop a doji trading strategy? In this article, we backtest a doji strategy on the S&P 500. A doji candlestick is formed when the opening and closing prices are nearly identical, signaling indecision in the market.
Many believe that candlesticks have no predictive value, but our backtests indicate that some of them might be useful. We even wrote an article about 3 bullish candlestick patterns that work.
We have also coded and backtested all 75 patterns. Please see candlestick patterns backtested and ranked.
We use candlesticks as a visual tool on our charts, but so far, we have yet to implement them as a stand-alone trading strategy. Confirmation from additional indicators is essential when trading Doji patterns to validate potential trend reversals. We use candlesticks as charting simply because they are visually more appealing and they make the chart more “readable”.
What is the candlestick pattern called doji?

The doji pattern is mainly classified as a “reversal” pattern, but that doesn’t mean that prices should reverse. It is more correctly viewed as simply the end of a trend. The market has been going in some direction, for example down, and then one day prices finish roughly where they started (the open and the close are more or less at the same price). The doji represents indecision in the market, signaling a temporary pause or balance between buyers and sellers. The significance of a doji depends on the current trend and the context in which the doji forms, as it can indicate a possible reversal or continuation depending on subsequent price action.
It is an indication that the bears might be losing control after knocking the index down for a few days. It does not necessarily mean we can expect a bullish upswing. The best time frame for candlesticks is daily bars.
We have a candlestick book written by Gregory L. Morris on our bookshelf called Candlestick Charting Explained. That’s a book we bought back in 1998. This is how Morris defines the doji pattern (he is using the term “spinning top”):
Spinning tops are candlestick lines that have small bodies with upper and lower shadows that are of greater length than the body’s length. This represents indecision between the bulls and the bears….The small body relative to the shadows is what makes the spinning top.
The doji formation is a key indicator of market indecision, and the doji represents a balance between buyers and sellers.
Morris then goes on to explain different types of dojis: doji, long-legged doji, gravestone doji, dragonfly doji, four price doji, stars, and paper umbrella. Quite exotic! A Doji is used together with other bars and candles.
Here is an example of a doji:

As you can see, the “body” is very small and the “shadows” are long. A doji candlestick is formed when a security’s open and close prices for the period are virtually the same. In this case, the doji formed a perfect bottom before rising. Traders should wait for confirmation from the next candlestick after a Doji before making trading decisions, as the bullish or bearish bias is determined by the current trend and subsequent confirmation.
Let’s look at it more systematically and backtest doji strategies on SPY, the ETF for the S&P 500, since its inception until today. Traders should look for confirmation from other indicators after a Doji appears to validate potential trend reversals or continuations.
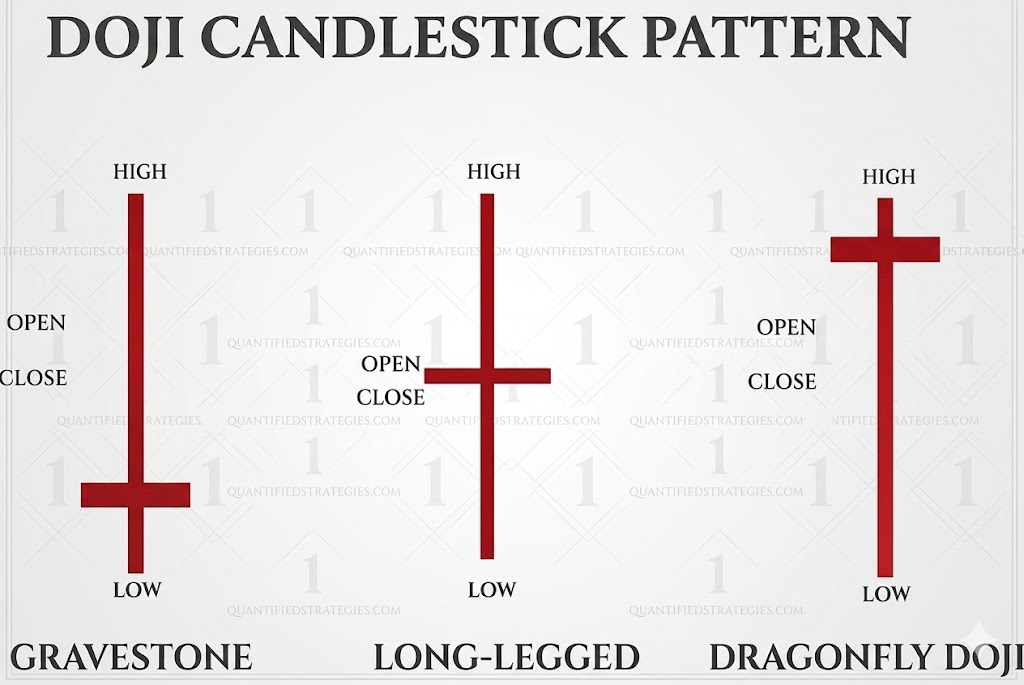
Types of Doji Candlestick Formations
The doji candlestick pattern comes in several distinct forms, each offering unique clues about market sentiment and potential price movement. Among the most recognized types of doji are the dragonfly doji, gravestone doji, and long-legged doji.
A dragonfly doji is characterized by a long lower shadow and little to no upper shadow, with the opening and closing prices positioned at or near the high of the trading session. This formation suggests that sellers pushed prices lower during the session, but buyers managed to bring the price back up to the opening level by the close. The dragonfly doji can signal a potential bullish reversal pattern, especially after a price decline.
In contrast, the gravestone doji features a long upper shadow and little to no lower shadow, with the opening and closing prices at or near the session’s low. This pattern indicates that buyers drove prices higher, but selling pressure ultimately pushed the price back down to the opening level. The gravestone doji often points to a potential bearish reversal, particularly after an uptrend.
The long-legged doji displays long upper and lower shadows, with the opening and closing prices near the middle of the range. This type of doji candlestick reflects significant price swings in both directions during the trading period, highlighting heightened indecision among buyers and sellers.
Understanding these types of doji candlestick formations—and recognizing their upper and lower shadows, as well as the relationship between opening and closing prices—can help traders refine their trading strategies and better anticipate possible trend reversals or continuations in the financial markets.
Doji candlestick strategy no.1:
Let’s define a Doji as we do in our ranking of all 75 candlestick patterns.
The only condition we used is that at least one day of the last two days must be a down day (including the doji), and the IBS indicator must be below 0.5. For additional confirmation, a bullish candle or bearish candle following a doji can provide further evidence of a possible reversal. We sell when the close ends higher than yesterday’s high. Here is the result:
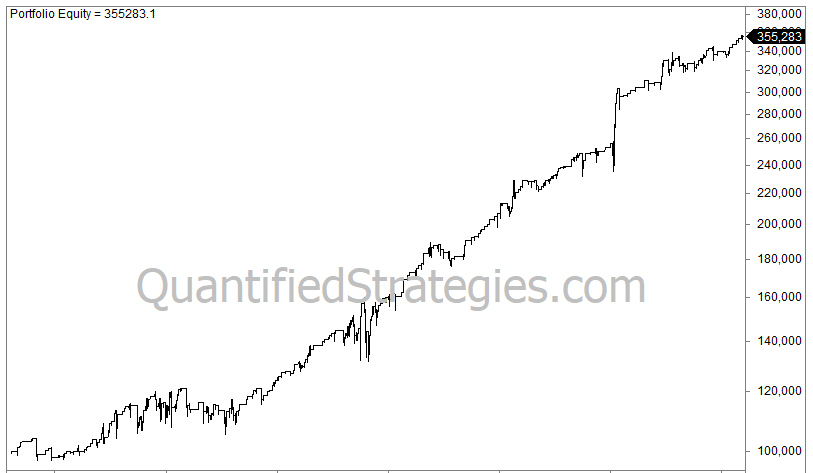
339 trades and 248 winners. The average gain is a 0.4% per trade after commissions and slippage of 0.03% per trade. Market participants often look for bullish confirmation after a doji forms, and using volume analysis alongside Doji patterns can enhance the reliability of trading signals.
Doji candlestick strategy no.2:
The doji is supposed to be a reversal pattern. What happens if we only go long if the close is below a 10-day moving average?
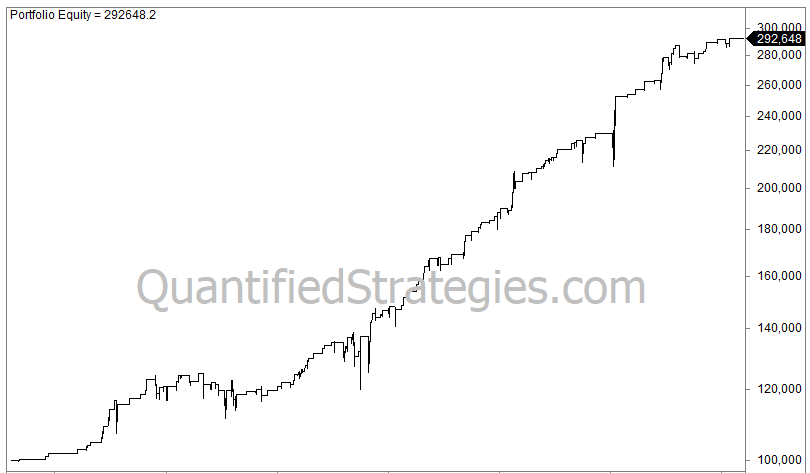
The number of trades is reduced to only 153, but 119 are winners. The average gain is 0.7% per trade, quite respectable.
What causes this good result? Luck? Good exit? We believe the main reason is that the market is somewhat “oversold” and we sell on a bounce. The effectiveness of the doji pattern may be enhanced when the market is in overbought or oversold conditions, especially when combined with other technical indicators like RSI or moving averages.
Traders should also consider the overall bullish or bearish bias indicated by prior price action and confirmation signals, as a doji alone is neutral and its significance depends on the prevailing bullish or bearish sentiment. The doji is most effective when used in conjunction with other technical indicators to confirm potential reversals or trend continuations. The doji might have some value, but we’re not sure.
Doji candlestick strategy no. 3: short
What if we turn it upside down? The IBS indicator must be higher than 0.8, and the close must be above the 10-day average. We cover when the close ends lower than yesterday’s close. If a bearish candle follows a doji, this combination can signal a possible reversal or price reversal, indicating that bearish pressure may be increasing.
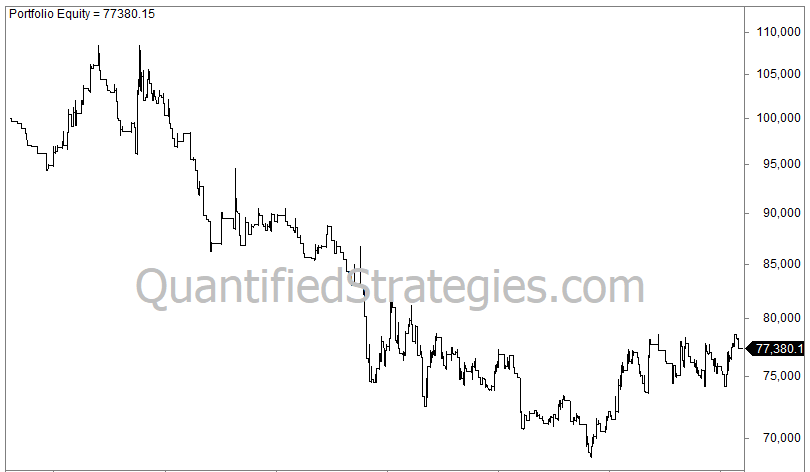
The average gain is a negative 0.05%. Thus, the strategy is flat, considering we included slippage and commission. It’s worth noting that the Gravestone Doji typically signals a potential bearish reversal, especially after an uptrend.
In general, short strategies are always a lot trickier than long ones. My experience has taught me that the market drops a lot faster than it rises. .
Doji Candles and Market Trends
The appearance of a doji candle on a candlestick chart can carry different implications depending on the broader market context. Doji candles may form during uptrends, downtrends, or periods of consolidation, and their significance often hinges on the prevailing trend and accompanying technical indicators.
In an established uptrend, a doji candle may signal that buying pressure is starting to wane, as neither bulls nor bears are able to push prices decisively in one direction. This can serve as an early warning of a potential reversal or a pause before the trend resumes. Conversely, when a doji appears during a bearish trend, it may indicate that selling pressure is losing momentum, suggesting a possible bullish reversal or at least a temporary halt in the price decline.
However, interpreting a doji candle requires careful consideration of the market context, including trading volume and other technical indicators. For example, a doji accompanied by high trading volume may carry more weight as a signal of market indecision or a potential turning point. By analyzing doji candles within the broader market context and in conjunction with other tools, traders can make more informed decisions and avoid false signals.
Doji Candlesticks in Cryptocurrency Trading
Doji candlesticks are especially relevant in cryptocurrency trading, where market indecision and rapid price swings are common. The doji candlestick pattern can help traders identify moments when buying and selling pressures are evenly matched, often preceding significant price reversals or breakouts.
Given the high volatility and 24/7 nature of cryptocurrency markets, doji candlesticks can serve as valuable signals for traders looking to capitalize on potential turning points. By combining doji patterns with other technical indicators and analyzing the broader market trend, traders can develop robust trading strategies tailored to the unique dynamics of digital assets.
When a doji candlestick appears on a crypto chart, it’s important to consider factors such as trading volume, recent price movement, and the overall market context before making trading decisions. Successful trading in cryptocurrencies often depends on recognizing market indecision and acting swiftly when a doji signal aligns with other technical evidence, helping traders navigate the fast-paced world of digital assets.
Doji backtest – video
https://www.youtube.com/watch?v=p3St7_mOOOI
Doji candlestick strategy – conclusions of backtest:
The doji candlestick pattern can be used as input into trading strategies or, as this article has shown, can be used as a stand-alone doji trading strategy.
The doji remains a key indicator of market indecision and potential trend reversals, especially when confirmed by other technical signals. The doji star is a specific reversal pattern that signals indecision and a potential trend reversal. The doji bullish, such as the dragonfly doji, is a variation that signals a potential bullish reversal at the bottom of a downtrend.
The doji candle pattern and doji candlestick formed are important concepts in technical analysis, as they help traders identify moments of indecision and possible reversal points.
The significance of a doji depends on its context within the current trend, and traders should always consider the overall bullish or bearish bias before making decisions. A doji represents indecision, and doji forms can indicate a possible reversal or price reversal, depending on the surrounding price action. Market participants analyze stock price, opening price, and low prices when interpreting doji patterns to better understand market sentiment.
The inverted cross is a specific doji shape used in technical analysis to identify unique price action scenarios. To manage risk, traders should place stop-loss orders just beyond the high or low of the Doji wick. However, dojis can produce false signals, particularly in volatile markets, so confirmation from other indicators is crucial. The Double Doji strategy is another approach, allowing traders to capitalize on strong directional moves that follow periods of indecision.
What is the Doji pattern in candlestick trading?
The Doji pattern is a candlestick pattern characterized by a small body with upper and lower shadows that are longer than the body. It suggests indecision in the market and is often considered the end of a trend. The open and close are nearly the same, indicating a potential reversal. In technical analysis, a Doji candlestick is interpreted as a sign of market indecision, where neither buyers nor sellers can gain control.
How many different candlestick patterns are there?
There are at least 64 different candlestick patterns with names. They can be used together or in conjunction with other bars to develop trading strategies. The article also mentions 3 bullish candlestick patterns that have been backtested for effectiveness.
How can the Doji pattern be defined, and what does it signify in trading?
The Doji pattern is mainly considered a “reversal” pattern, indicating the end of a trend rather than a specific reversal. It suggests indecision between bulls and bears, often occurring after a directional move in the market. The best time frame for analyzing candlesticks is mentioned as daily bars.
Final Thoughts on Doji Strategies
To summarize our findings on the Doji candlestick pattern:
- Indecision is Key: The near-identical open and close prices signal a temporary equilibrium between bulls and bears.
- Context Matters: A Doji following a prolonged downtrend (oversold) tends to perform better in backtests than one appearing in a neutral sideways market.
- Systematic Edge: Our Strategy No. 2 showed that combining a Doji with a 10-day moving average filter significantly increased the win rate to 77%.
- Risk Management: Because Dojis represent uncertainty, always use the candle’s “shadows” (highs/lows) to inform your stop-loss placement.
The Doji is a valuable tool in a trader’s quest to read market “readable-ness,” but it works best as a piece of a larger, backtested puzzle.
Frequently Asked Questions About Doji Trading
How to trade a Doji candlestick pattern?
Based on backtesting results, the most effective way to trade a Doji is as a reversal signal rather than a standalone strategy. Traders should look for confirmation from the subsequent candle or additional indicators like the IBS (Internal Bar Strength).
For example, a common strategy involves entering a long position when a Doji forms after a down day and selling when the price closes higher than the previous day’s high. To manage risk, stop-loss orders should be placed just beyond the high or low of the Doji’s shadows.
How reliable is a Doji pattern?
While many market participants believe candlesticks lack predictive value, backtests on the S&P 500 suggest they can be useful when combined with other data. The reliability of a Doji increases when the market is in “oversold” conditions (such as trading below a 10-day moving average).
However, because Dojis represents indecision, they can produce false signals in highly volatile markets; therefore, confirmation from volume analysis or technical indicators is essential.
What time frame is best for Doji?
According to the technical analysis provided, the most effective time frame for identifying and trading candlestick patterns is daily bars. This interval provides enough data to accurately reflect the balance between buyers and sellers and minimizes the “noise” found in shorter time frames.
Can a Doji be bullish or bearish?
A Doji is inherently neutral, representing a temporary pause or balance between bulls and bears. However, its bias is determined by its form and context:
–Indecision: A Long-legged Doji reflects significant price swings in both directions, signaling heightened uncertainty.
-Bullish: A Dragonfly Doji (long lower shadow) at the bottom of a decline suggests sellers are losing control.
-Bearish: A Gravestone Doji (long upper shadow) after an uptrend suggests buying pressure is waning.