
Key Reversal Day Pattern: How to Spot and Trade High-Probability Market Turns (Backtest)
Key Reversal Day Pattern signals are often the difference between catching a massive trend change and getting trapped in a “dead cat bounce.” While many traders see a price fluctuation and guess, professional price action traders look for the specific confirmation of a true Reversal Day Strategy. In this guide, we break down exactly how to identify a genuine Key Reversal on your charts, the volume requirements you can’t ignore, and how to execute the trade before the rest of the market catches on.
This article will discuss the idea of a reversal day strategy, its potential causes, and the significance of identifying these signals in the stock market. This post will offer helpful ideas on analyzing market movements and making wise judgments, whether you’re an experienced investor or just learning about the stock market. So let’s get started and learn more about Reversal Day before we make a backtest of the strategy.
Key Takeaways: The Anatomy of a Reversal
A Key Reversal Day Pattern is a high-conviction price action signal where the market’s momentum completely shifts within a single session.
- Bullish Reversal: Price sets a new lower low (testing support) but manages to close above the previous day’s high.
- Bearish Reversal: Price sets a new higher high (testing resistance) but closes below the previous day’s low.
Pro Tip: These signals carry more weight when they coincide with high relative volume or momentum divergences (like RSI or MACD), proving the old trend has finally exhausted itself.
Backtest Results: Does the Strategy Work?
We put the Key Reversal Day to the test using historical data on the GLD (Gold ETF). Our proprietary research reveals a stark difference between bullish and bearish setups.
Performance Comparison (GLD)
| Setup Type | Best Average Trade | Optimal Exit Window | Profit Factor |
| Bullish Reversal | +2.02% | 24 Trading Days | > 1.0 (Profitable) |
| Bearish Reversal | Negative | N/A | < 1.0 (Unreliable) |
The Statistical Verdict
Our backtest proves that the bullish pattern has significant statistical merit in the gold market. Conversely, the bearish pattern underperformed, largely due to the market’s natural “overnight upward drift.”
Practical Conclusion for Traders
- Results are Market-Specific: Always re-test this pattern on the specific instrument you trade; what works for Gold may not work for Forex or Tech stocks.
- Quantify the Trigger: Discretionary trading is risky. Ensure you have a fixed “look-back” window and a clear entry trigger.
- Use as a Filter: Because these setups are infrequent, use them as high-conviction filters within a broader mean-reversion system rather than a standalone strategy.
What Is A Key Reversal Day Pattern?
What is a reversal day?
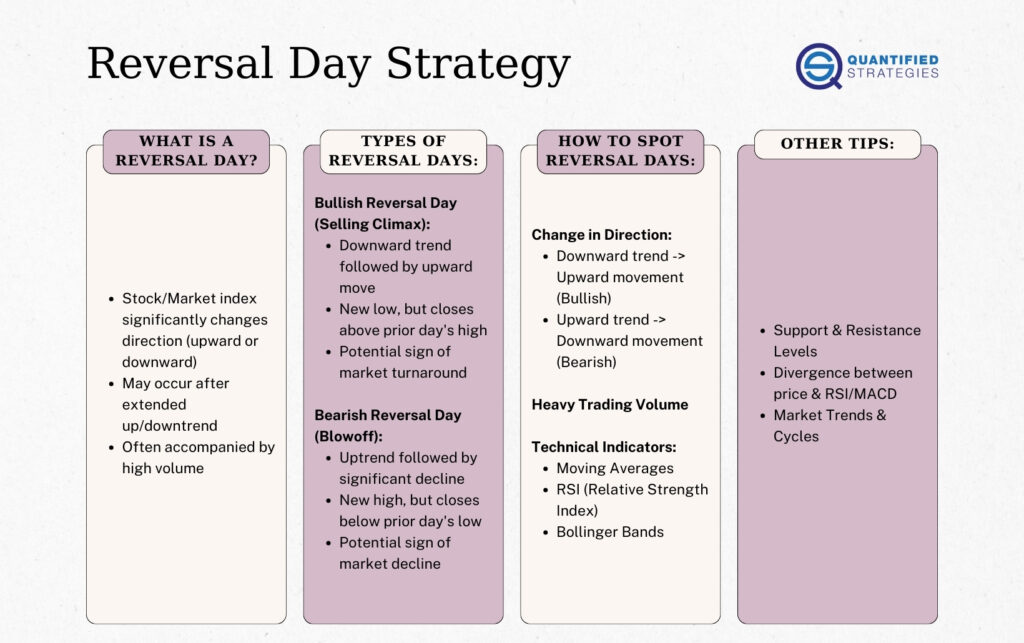
A stock or market index experiencing a substantial change in direction, either upward or downward, is referred to as having a “Reversal Day.” This shift in trend can happen after an extended uptrend or downtrend, and it sometimes coincides with high volume in the market. Traders and investors often see Reversal Days as a crucial signal of impending market reversals.
Reversal Days, also known as Blowoffs or Selling Climaxes, come in various forms, each with distinctive qualities.
For instance, a “Bullish Reversal Day” or Selling Climax typically occurs after a bearish trend, when the stock price makes a new low that is lower than the previous day, but the day eventually ends bullish, closing above the previous day’s high. This can signal the start of a new bullish trend.
This is sometimes interpreted as a signal of a future market turnaround and might be positive news for investors and traders. This is the theory referred to in most articles and books. Is it correct? We backtested it further down in the article.
A “Bearish Key Reversal Day,” or blowoff, on the other hand, happens when a stock or market index significantly declines following a prolonged rally, or bullish trend. The day might be characterized by the stock price making a new high that is higher than the previous day, but the day eventually ends bearish and closes below the previous day’s low. This may indicate the beginning of a bearish trend.
This is frequently interpreted as a signal of a potential market decline and is a warning sign for investors. Again, this is the theory, and we backtest this exact pattern later in the article.
Reversal candlestick patterns signal a potential change in market direction, acting as early warning systems for traders. High-volume reversal days are more significant than those with low volume, suggesting a strong trend reversal. Traders often use price charts to identify these reversal day patterns and inform their trading decisions.
What Causes A Trend Reversal In Stocks?
Several different factors can cause a reversal in stocks. Some of the most common include changes in market sentiment, economic conditions, and company-specific news.
One of the primary drivers of a stock reversal is a change in market sentiment. Market sentiment refers to the overall attitude or feeling of investors towards a particular stock or market.
When sentiment is bullish, investors are optimistic and tend to buy stocks, which can drive prices up. On the other hand, when sentiment is bearish, investors are pessimistic and tend to sell stocks, which can drive prices down.
Economic conditions can also play a major role in stock reversals. For example, an unexpected change in interest rates, inflation, or gross domestic product (GDP) can cause a reversal in stock prices. Economic indicators such as unemployment rates, consumer confidence, and manufacturing activity can also impact the stock market and cause a reversal.
Company-specific news can also be a major driver of a reversal in stocks. For example, positive news, such as a company’s earnings beat or a new product launch, can cause a stock to rise. In contrast, negative news, such as a management shakeup or regulatory investigation, can cause a stock to fall.
Stock reversals can also happen due to technical analysis, which studies past market data, primarily price and volume, to identify patterns and make trading decisions. Technical analysts look for trends, chart patterns, and indicators to determine the future direction of prices, and this is where the Reversal Day pattern comes in. Traders specifically look for candlestick patterns and candlestick formations on price charts to identify potential reversals, as these visual patterns reflect shifts in market psychology. Momentum indicators are often used alongside candlestick patterns to confirm reversal signals and validate the strength of a potential move. It’s important to note that reversal candlestick patterns signal a change in trend, while continuation patterns indicate a pause before the existing trend resumes. Traders should combine candlestick patterns with technical confluence factors like support/resistance levels, trend lines, moving averages, and momentum indicators. Traders often combine candlestick patterns with other technical indicators to validate predictions and provide a more comprehensive view of the market.
Over the last 30 years, the stock market has been prone to mean reversions. This means that an overbought stock tends to perform weaker in the nearest days compared to a stock that is not overbought.
How To Spot A Key Reversal Day?
Spotting a Reversal Day can be challenging, but there are several key indicators that traders and investors can look for to identify potential market turnarounds.
One of the most important indicators of a Reversal Day is a change in the direction of a stock or market index. This can be identified by looking at the stock’s or index’s chart and analyzing its trend. A bullish Reversal Day is characterized by a stock or index in a downtrend and then experiencing a significant upward movement, often signaled by bullish patterns or bullish reversal candlestick patterns. Conversely, a bearish Reversal Day is characterized by a stock or index in an uptrend and then experiencing a significant downward movement, which may indicate a potential bearish reversal.
Potential bullish reversals and potential bearish reversal can be identified through these candlestick patterns and technical signals. However, without confirmation, bullish reversal patterns would be considered neutral and merely indicate a potential support level at best.
Another important indicator to look for is heavy trading volume. A Reversal Day is often accompanied by an increase in trading volume, which can indicate a significant change in market sentiment. This is because an increase in trading volume is often associated with increased buying or selling pressure, which can drive a stock’s or index’s price in one direction or another.
Technical indicators such as moving averages, relative strength index (RSI), Bollinger Bands, and momentum indicators like RSI or MACD can also be useful in identifying potential Reversal Days. These indicators can help traders and investors confirm the strength of bullish reversal candlestick patterns and bullish patterns by identifying changes in momentum and overbought or oversold conditions, which can indicate a potential market turnaround. Reliable trading signals are achieved by combining candlestick patterns with other technical analysis tools, such as support and resistance, momentum oscillators, and volume indicators, to improve prediction accuracy and reduce false signals.
Effective reversal day strategies involve identifying overextended stocks and waiting for confirmation via candlestick patterns and high volume.
Proper risk management is essential when trading reversal day strategies. This includes setting clear stop-loss levels, managing position sizes, and understanding your risk tolerance to protect your capital.
Here you can find all our Trend reversal trading strategies
Example Of Reversal Candlestick Patterns In a Chart
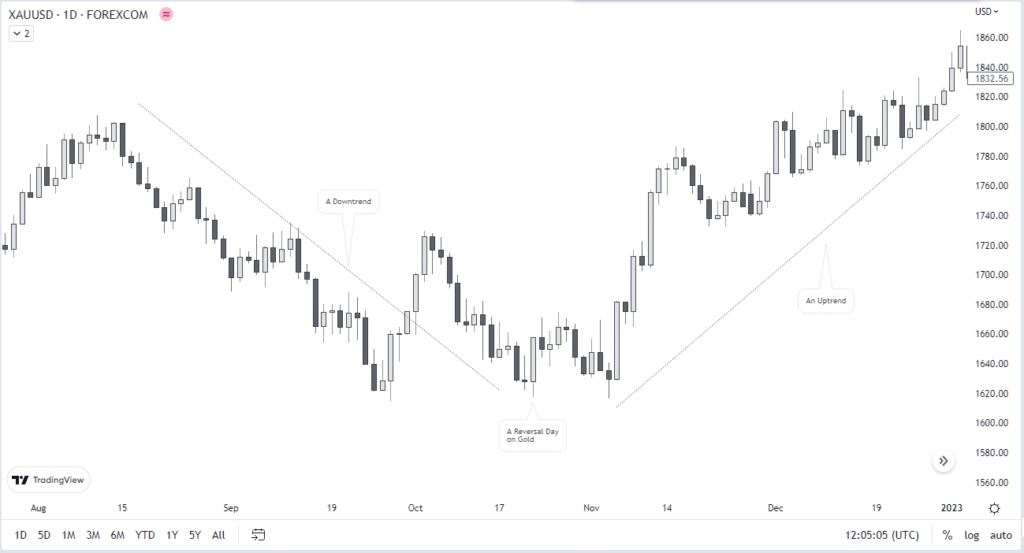
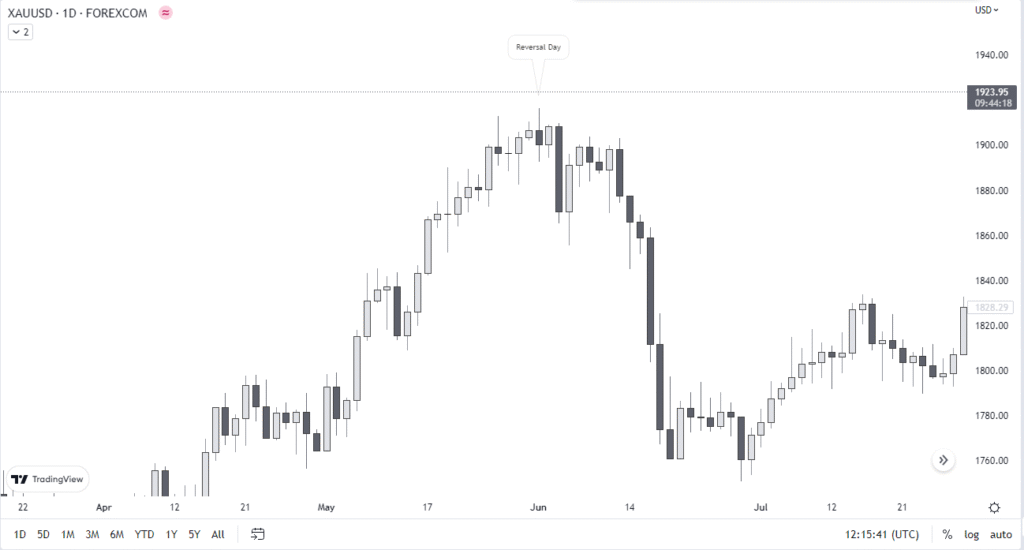
Reversal day example
We have talked about reversal days and how to spot them. Now, let’s get to spot it together on this gold chart.
From the previous explanation, we can spot the above chart as a selling climax (Bullish Reversal Day) because the trend was bearish until the reversal day, after which it turned bullish. Such patterns, including the engulfing candle seen here, are classic reversal signals in technical analysis. The engulfing candle is significant because it shows strong buying pressure, especially when the second candle completely engulfs the previous one. The second candle, or second candlestick, plays a crucial role in confirming the reversal, as its size and position relative to the first candle indicate the strength of the move. Bullish confirmation means further upside follow through and can come as a gap up, long white candlestick or high volume advance.
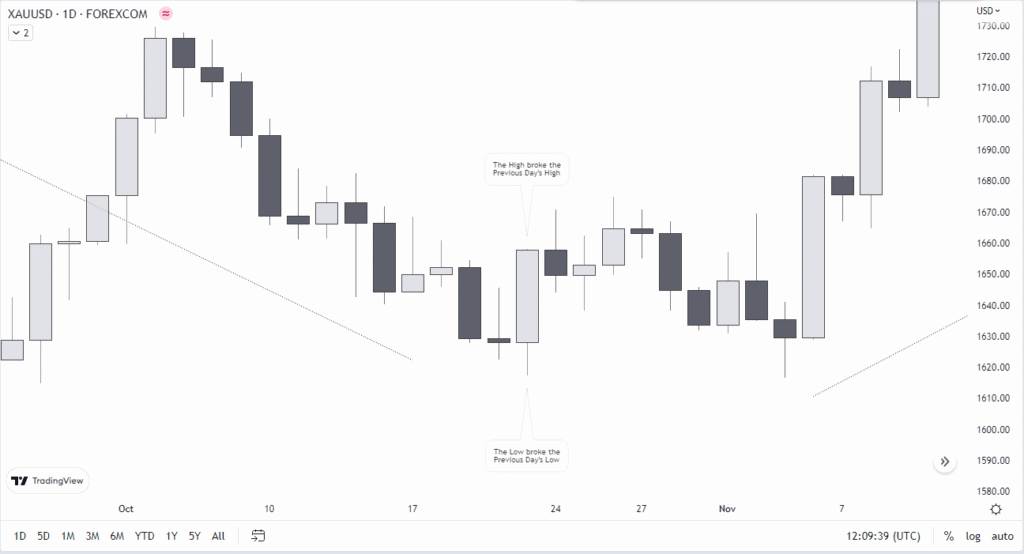
Example reversal day
Another thing we want to pay attention to is the high and low of the day with respect to the previous day’s price action. We have earlier stated that a bullish reversal day’s low will first take out the previous day’s low, then reverse and take out the previous day’s high. This chart did just that.
What Markets Are Prone To Reversals?
For various reasons, different markets are prone to reversals, and traders and investors must understand the characteristics of the markets they are trading in.
The stock market, for example, is known for its volatility and is prone to reversals due to various factors, including changes in market sentiment, economic conditions, and company-specific news. In volatile markets, traders often look for signs of an upcoming reversal, such as breaks in resistance or support levels, especially when confirmed by increased trading volume. The stock market also tends to be driven by technical analysis, which can indicate a reversal based on chart patterns and technical indicators. It’s important to note that not all chart patterns signal a reversal; some, known as continuation patterns, indicate a pause before the existing trend resumes rather than a change in direction.
The currency market, also known as the forex market, is known for its liquidity and tends to be driven by economic conditions and political events. For example, a change in interest rates, inflation, or a political crisis can cause a reversal in currency prices.
The commodity market is also prone to reversals, especially in markets such as oil, gold, and agricultural products. Commodities are sensitive to global demand and supply, and geopolitical events can lead to sudden price changes. For example, an oil-producing country’s decision to cut production can lead to a sudden increase in oil prices and a Bullish Reversal Day.
The bond market is characterized by its stability and slow-moving nature but can also experience reversals. Interest rate changes, inflation, and economic indicators can cause bond prices to fluctuate, leading to potential bond market reversal.
Other Tricks And Tips About Reversal Days
While understanding the indicators of a Reversal Day is essential, there are other tricks and tips that traders and investors can use to identify potential market turnarounds.
One helpful trick is to pay attention to support and resistance levels. Support levels are the levels at which a stock or market index finds buying pressure, and resistance levels are the levels at which a stock or market index finds selling pressure. When a stock or market index breaks through a significant support or resistance level, it could indicate a potential reversal. However, the problem with support and resistance is that it’s almost impossible to quantify. It requires a great deal of discretionary judgment.
Bullish reversal strategy
Another tip is to use price charts to spot divergences and reversals, especially when combined with momentum indicators such as the relative strength index (RSI) or moving average convergence divergence (MACD) indicator. A divergence occurs when the stock or market index moves in one direction while the RSI or MACD moves in the opposite direction, which could indicate a potential reversal. Reliable trading signals are often achieved by combining candlestick patterns with other technical analysis tools, including momentum oscillators and volume indicators, to improve prediction accuracy and reduce false signals.
Proper risk management is crucial when using these tips, including setting clear stop-loss levels, managing position sizes, and understanding your risk tolerance. Traders and investors should also consider the market’s overall trends and cycles. For instance, it’s important to note that the market tends to experience bullish and bearish trends at certain times of the year.
Strict risk controls are essential in reversal trading to manage the higher frequency of false reversals.
Reversal Day Backtest – Does It Work?
There are many ways you can make trading rules for a reversal day. A reversal day strategy is a counter-trend trading approach designed to identify market turning points where an asset’s price changes direction.
Let’s go on to backtest two reversal day strategies:
Reversal day strategy backtest no 1 (bullish reversal day)
We make the following trading rules (based on the descriptions earlier in the article):
The reversal day strategy backtest identifies a bullish setup by scanning for bullish reversal candlestick patterns. These patterns are used to capture bullish reversals and potential bullish reversals in the market. For example, one common bullish reversal pattern is the bullish engulfing pattern, which consists of two candlesticks: the first is black and the second is white, with the white body totally engulfing the body of the first black candlestick. The strategy aims to enter trades when such patterns appear, signaling a possible change from a downward to an upward trend.
Trading Rules
THIS SECTION IS FOR MEMBERS ONLY. _________________ BECOME A MEBER TO GET ACCESS TO TRADING RULES IN ALL ARTICLES CLICK HERE TO SEE ALL 400 ARTICLES WITH BACKTESTS & TRADING RULES
The last trading rule (RSI) indicates that the trend has been negative over the last few days. The trading rules above are just one example of how you can define a reversal day. There are, of course, unlimited ways you can define such a turnaround.
We use Amibroker’s optimizer function and exit after 1-20 trading days in gold (GLD). We get the following statistics and performance metrics in our backtest:
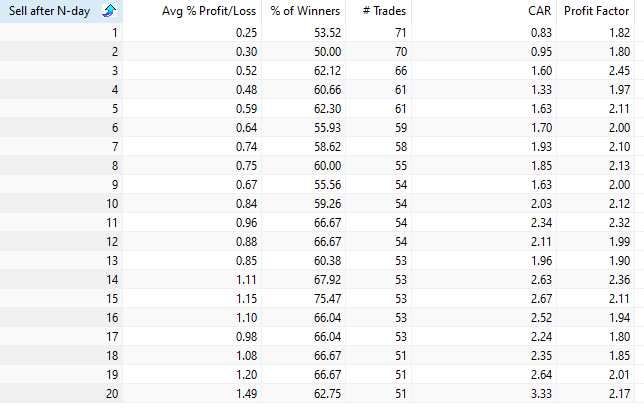
The first column tells us the day we exit. For example, row 20 indicates that the highest average gain per trade is when we exit after 20 trading days (1.49%). Overall, column 5 shows that the profit factor is pretty good for almost all exits, but the drawback is a few trades.
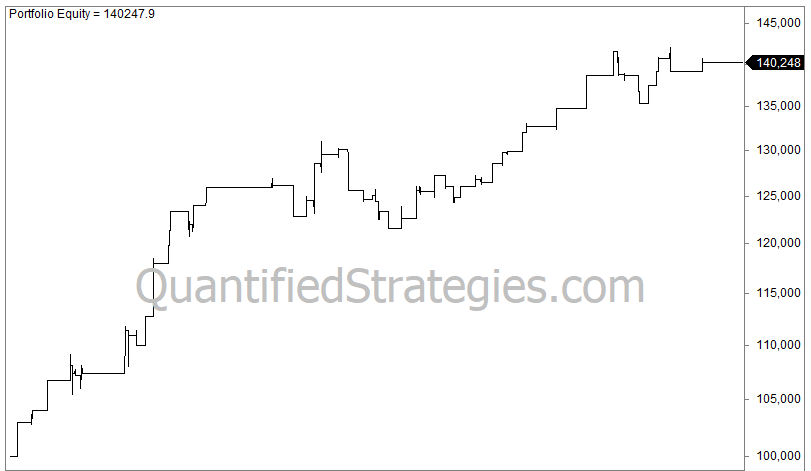
The equity curve if we exit after 3 days looks like this:
Reversal day strategy backtest no 2 (bearish reversal day)
Let’s change the trading rules from our bullish Reversal Day backtest and make the following trading rules:
- Today’s high is higher than yesterday’s high
- Today’s close is lower than yesterday’s close
- The five-day RSI must be higher than 65
This setup typically follows a bullish trend and may signal the start of a bearish trend, indicating a potential bearish reversal. In candlestick analysis, this day often forms a bearish candle, which can be part of reversal patterns such as the bearish harami. The bearish harami, a two-candlestick pattern, is a subtle signal that may require confirmation from subsequent candles or volume analysis, especially near resistance levels.
As a practical tip, stop-losses in reversal trades are typically placed just beyond the extreme high or low of the reversal candle.
We use Amibroker’s optimizer function and exit after 1-25 trading days in gold (GLD), and we get the following statistics and performance metrics:
Bullish reversal meaning
Because of the upward drift from gold’s night session (please look at Gold Overnight Strategy), the bearish reversal produces losses (see column 3). However, the average gains are significantly lower than the bullish Reversal Day.
Risk Management Techniques for Reversal Day Strategies
Risk management is a cornerstone of successful trading, especially when employing reversal day strategies that rely on identifying bullish reversal patterns or bearish reversal patterns. Because reversal trades often occur at potential market turning points, the risk of false signals and unexpected price movement is high. Implementing robust risk management strategies can help traders protect their capital and enhance the reliability of their trading signals.
One of the most effective risk management techniques is the use of stop-loss orders. When entering a trade based on a bullish reversal pattern—such as a bullish engulfing pattern, hammer pattern, or morning star pattern—traders should set a stop-loss just below the low of the first candle in the pattern. This approach limits downside risk if the anticipated trend reversal fails to materialize. Similarly, for bearish reversal patterns like the bearish engulfing pattern or dark cloud cover, a stop-loss above the high of the reversal candlestick formation can help contain losses.
Proper position sizing is another essential component of risk management. By calculating the optimal trade size based on account size, risk tolerance, and the distance to the stop-loss, traders can ensure that no single reversal trade jeopardizes their overall portfolio. This is particularly important when trading volatile setups or when the prevailing trend is strong and a potential reversal is less certain.
Monitoring market momentum and technical analysis indicators is also crucial. Tools such as the relative strength index (RSI), moving averages, and momentum oscillators can provide further bullish confirmation or warn of momentum divergence, signaling a possible trend reversal or the risk of a false signal. Volume analysis can also confirm the strength of a reversal signal—higher volume on a reversal day often indicates strong buying or selling pressure from market participants.
Advanced traders may incorporate the sushi roll reversal pattern or combine multiple reversal candlestick patterns—such as pairing a bullish harami with a hammer candle—to increase the reliability of their trading signals. Additionally, identifying support and resistance levels, trend lines, and using moving averages to gauge the prevailing trend can help refine entry and exit points for reversal trades.
It’s important to remain flexible and adjust risk management strategies as market sentiment shifts or as new technical signals emerge. For example, if a positive divergence appears on the RSI or a large bullish candle forms at a key support level, traders might tighten stop-losses or scale into positions gradually to manage risk more effectively.
In summary, effective risk management for reversal day strategies involves a combination of stop-loss placement, proper position sizing, technical analysis, and ongoing monitoring of market momentum and sentiment. By integrating these techniques—alongside candlestick charts, volume analysis, and confirmation from multiple reversal patterns—traders can minimize losses, avoid false signals, and capitalize on potential market shifts with greater confidence. Remember, risk management is not a one-time setup but an ongoing process that adapts to changing market conditions and ensures long-term trading success.
Conclusion
Understanding the concept of Reversal Day and the factors that can cause them is important for making informed investment decisions. As a trader or investor, you should pay attention to a stock or market index’s (or whatever market you are trading) trend, trading volume, technical indicators, and company-specific news to identify potential market turnarounds. Our backtests indicate that the idea of a Reversal Day has merit.
By incorporating these techniques into your analysis and keeping an eye on the market conditions, you’ll be better equipped to spot potential Reversal Days and make smart investment decisions.
List of trading strategies
We have written over 2000 articles on this blog since we started in 2012. Many articles contain specific trading rules that can be backtested for profitability and performance metrics.
The trading rules are compiled into a package where you can purchase all of them (recommended) or just a few of your choice. We have hundreds of trading ideas in the compilation. Please check out our different memberships.
What causes a Reversal in stocks?
Several factors can cause a reversal in stocks, including changes in market sentiment, economic conditions, and company-specific news. Market sentiment, economic indicators, and unexpected events can influence stock prices and lead to a reversal.
What are the different types of Reversal Days?
There are two main types of Reversal Days – Bullish Reversal Day and Bearish Reversal Day. A Bullish Reversal Day occurs when a stock moves upward after an extended downtrend, while a Bearish Reversal Day happens when a stock declines following a prolonged rally.
How is a Bullish Reversal Day identified?
A Bullish Reversal Day is identified by a stock in a downtrend experiencing a significant upward movement. It often involves a new low lower than the previous day, but the day ends bullish, closing above the previous day’s high. A Bearish Reversal Day is characterized by a stock in an uptrend experiencing a significant downward movement.
What is an inverted hammer and why is it important?
An inverted hammer is a single-candle bullish reversal pattern that appears during a downtrend. It has a small real body and a long upper shadow, which is at least twice the length of the real body, indicating a potential trend reversal after a failed upward attempt.
What is a hammer pattern?
The hammer is made up of one candlestick with a small body, long lower shadow, and small or nonexistent upper shadow. It is a bullish reversal pattern that signals potential trend reversal when it appears after a downtrend.
What is a morning doji star and what is the role of the middle candle?
A morning doji star is a bullish reversal candlestick pattern formed by three candles, typically appearing near support levels. The middle candle is often a doji, indicating market indecision and reinforcing the strength of the reversal signal. The pattern is significant in technical analysis and is compared to similar patterns like the morning star and bullish abandoned baby.