The Probability of a Loss in The Stock Market
Adapted from the original article by Ben Carlson on A Wealth of Common Sense.
Investing in the stock market isn’t a guarantee of smooth gains. Instead, it’s a mathematical game of odds, and understanding those odds is critical for long-term investors.
The stock market is famously volatile in the short run. Over days, weeks, and even months, prices swing, often wildly, in response to economic news, interest rates, earnings reports, geopolitical events, and investor psychology. Yet over longer periods, the odds of positive returns improve significantly, even if losses occur along the way.
Short-Term vs Long-Term Odds
Historically, when you look at a long enough time frame, the probability of a loss drops dramatically compared to short-term fluctuations:
- Over shorter time frames (like days or months), drawdowns of 5%, 10%, or even 20% are very common.
- Over multi-year horizons, the odds of ending up in the red decline materially, even though temporary losses still happen frequently.
That’s because the long-term upward drift of stocks, driven by economic growth, corporate earnings, and reinvested dividends, tends to outweigh periodic setbacks.
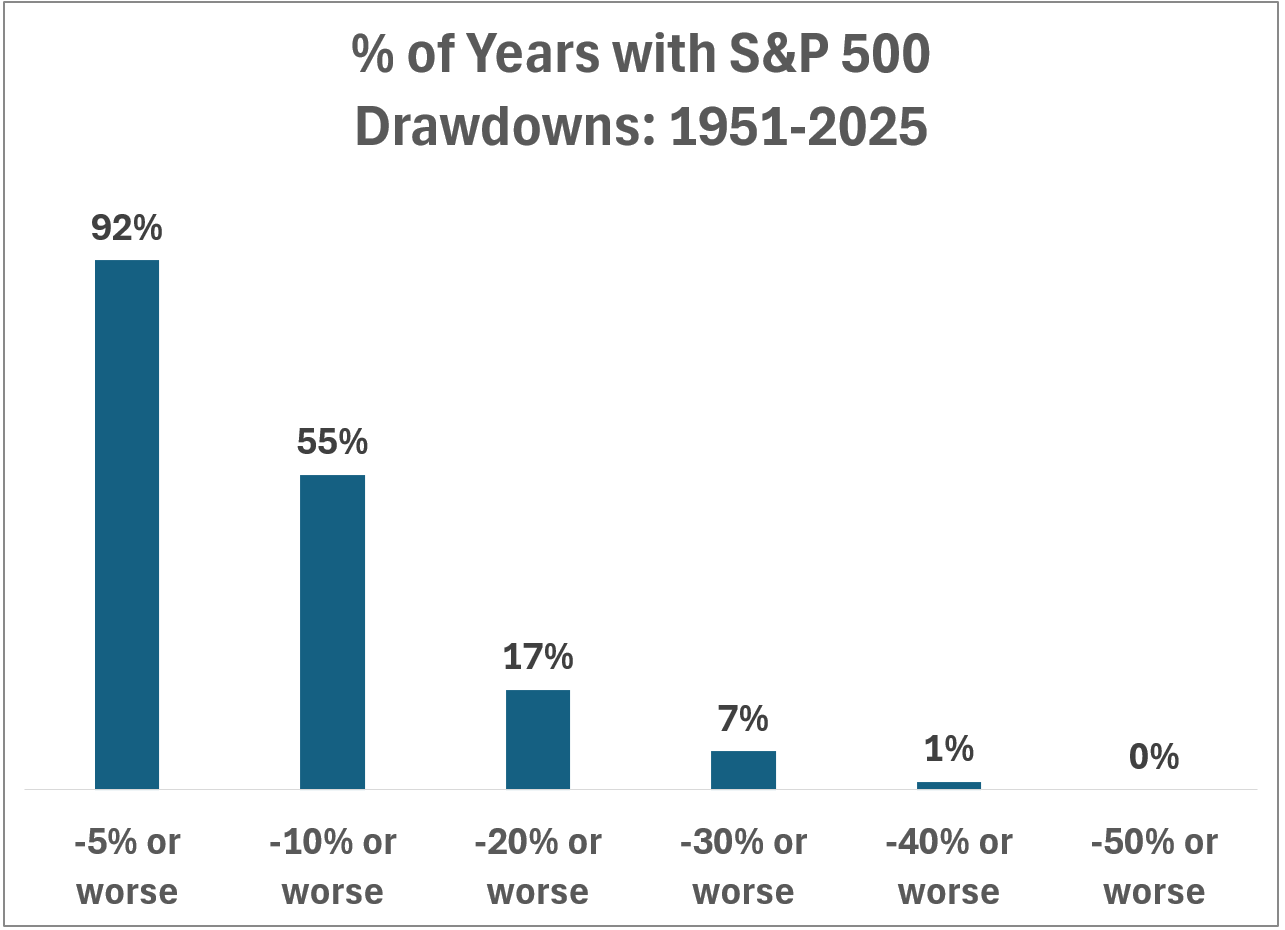
What the Historical Data Shows
Here’s what key historical evidence tells us about drawdowns and losses:
- Since the early 20th century, the S&P 500 has experienced a peak-to-trough decline of 10% or worse in roughly two-thirds of all calendar years.
- A 5% correction occurs in most years.
- Bear markets (20%+ declines) happen regularly over decades, even if they are less frequent than smaller pullbacks.
- However, losing years become less common over longer holding periods. In multi-year windows, the chance of a loss drops sharply as the time horizon extends.
And while past performance is not a guarantee of future results, history provides valuable context for what investors might reasonably expect. Short-term losses are normal; long-term outcomes have historically tended to reward patience and discipline.
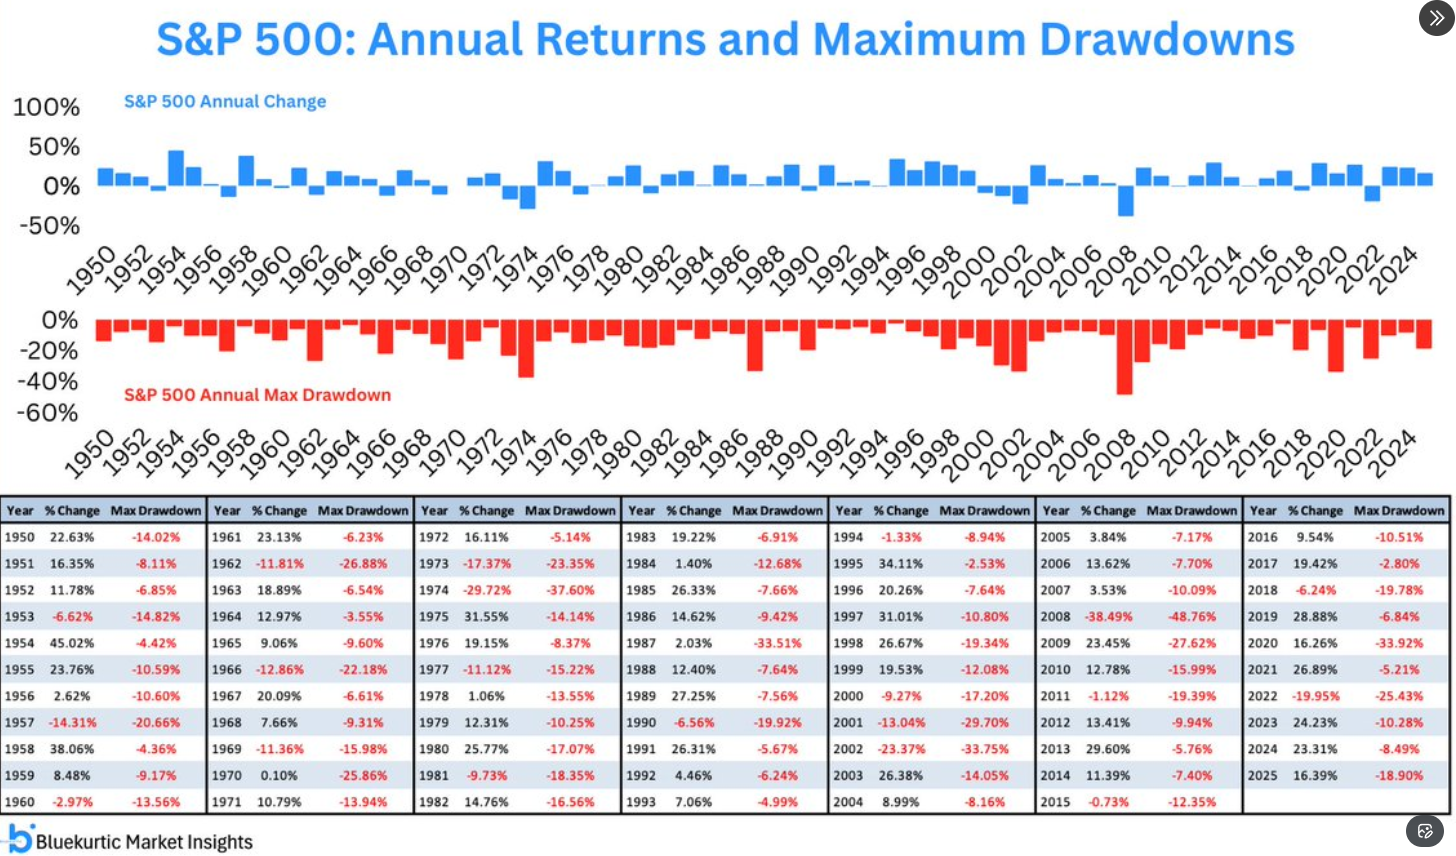
Historical Drawdowns: S&P 500 (1950–2025)
Below is a chart showing annual maximum drawdowns of the S&P 500 from 1950 through 2025. The chart highlights the frequency of significant intra-year declines and their year-to-year variability.
Annual Returns and Maximum Drawdowns
We found the following chart of interest from Twitter/X (@Bluekurtic):