
Three Stars in the South: Candlestick Pattern
As fancy as the name might sound, the Three Stars in the South candlestick pattern is just an extremely rare bullish reversal candlestick pattern. In this post, we will discuss the pattern in detail. Here are some of the things you will learn:
What comes to your mind when you hear the phrase “Three Stars in the South?” A constellation seen only from Auckland or Sydney? Or, the Star of the South — an enormous diamond found in Brazil in 1853? Maybe, none of those. Well, if you have been trading for some time and you are an avid follower of the candlestick pattern, you would know that it refers to a unique candlestick pattern with specific characteristics.
Key Takeaways
- What the Three Stars in the South trading pattern is
- How to identify it
- What the pattern tells you
- The psychology behind the pattern
- How to trade the pattern
- The difference between the pattern and the Three Black Crows pattern
- The drawbacks of the pattern
What is the Three Stars in the South trading pattern?
The Three Stars in the South is a bullish reversal pattern that is seen on candlestick charts, and it is made up of three consecutive bearish candlesticks. It normally appears after a price decline, where it may indicate that the downswing is losing momentum. The pattern doesn’t appear easily; it is quite rare.
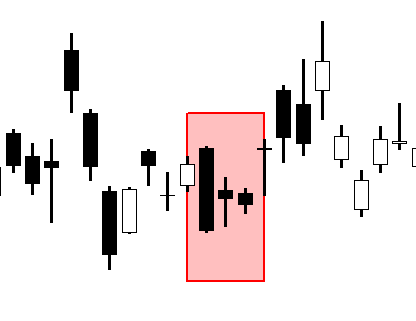
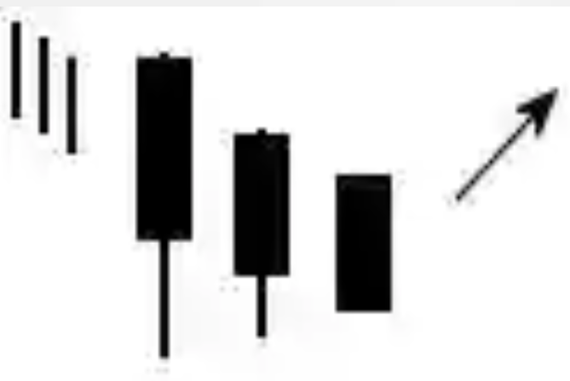
When it occurs in a chart, it is seen in a downtrend, a prolonged pullback in an uptrend, or the downward swing in a range-bound market. Consisting of three bearish candlesticks, the pattern starts with a long bearish candlestick with a long lower shadow, followed by a smaller version of the initial candlestick with a higher low and a lower high and finally followed by a small black Marubozu that starts and ends within the range of the preceding candlestick. In essence, the range of every candlestick in the pattern is completely covered by the range of the candlestick preceding it — more like an inside bar (harami pattern) within an inside bar.
The bullish Three Stars in the South candlestick pattern reflects a downward price move that is slowly losing its momentum and is characterized by diminishing daily price ranges and consecutively higher lows. Although each day closes lower than the last, the bears are making less progress than they were previously. Each candlestick’s range engulfs the next one, so it shows that the downswing is probably coming to end and will likely reverse into an uptrend. Everything points out that the tide is slowly turning towards the bulls’ side. At any moment, the bulls may step in to push the price up again, so it is expected that the price will soon start climbing up.
When you see the Three Stars in the South pattern, know that a change in price direction is around the corner because, as the downtrend deteriorates, the chance of a reversal heightens. While this pattern is said to have a good rate of success, it is not easily seen on the price chart. So if you get to see it, you are lucky. You trade it the same way you trade other bullish reversal candlestick patterns. We will get to that later; let’s first discuss how you can identify the pattern.
The anatomy of the Three Stars in the South pattern: how to identify it
The candlesticks that make up this pattern have specific characteristics. Let’s take a look at them one by one:
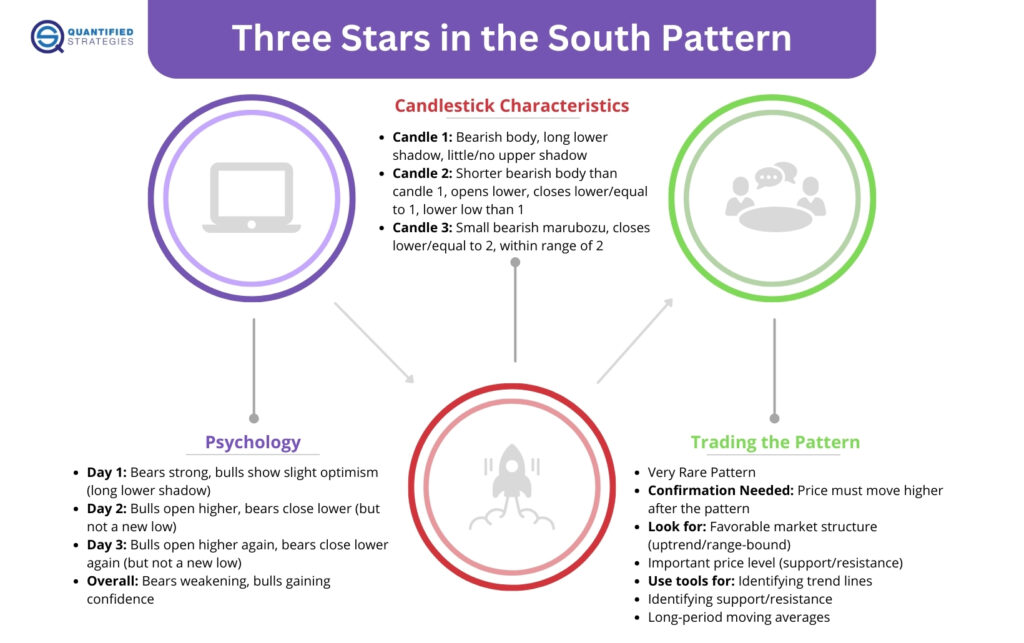
The first candlestick is characterized by:
- a candlestick in a downward price swing
- bearish body (black, red, or whatever color chosen to represent bearishness)
- long lower shadow
- little or no upper shadow
The second candlestick is characterized by:
- bearish body (black, red, or whatever color chosen), which is shorter than that of the first candlestick
- opening below the preceding candlestick’s open
- closing below or at the same level as the preceding candlestick’s close
- the low being above the preceding candlestick’s low
The third candlestick is characterized by:
- a small marubozu candlestick with a bearish body
- appearing as a short line
- closing below or at the same level as the second candlestick’s close
- the candlestick being located within the range of the preceding candlestick
So, the Three Stars in the South is classified as a three-line bullish reversal pattern and is characterized by diminishing daily price ranges and consecutively higher lows but with consecutively lower closing prices. Although each day closes lower than the preceding day, there is no serious advancement in the downward movement as each candlestick’s range engulfs the next one. All the candlesticks in the pattern are getting shorter and having black bodies.
Now, you know that the name of the pattern is somewhat misleading because there are no doji kinds of candlesticks in the pattern and there are no price gaps between the candlesticks. The first line of the pattern appears as a long line with a long lower shadow which may even be longer than the body. What this means is that the first line may be formed by the Hammer (Takuri Line) pattern. While the second line opens below the previous candlestick’s opening price and closes below its closing price, the low price should be higher than the prior low price. The third line, being a small marubozu candlestick with a black body (as the rest), the candlestick fits within the range of the line before it, and it appears as a short line. As a result of the stringent criteria that must be met to identify the pattern, the Three Stars in the South is rarely seen on the price charts.
What does the Three Stars in the South trading pattern tell you?
The Three Stars in the South pattern tells a very simple story about price movement: The bears are gradually losing momentum with the appearance of each of the candlesticks that make up the pattern. You know, from what we have discussed so far, that this candlestick pattern is preceded by a strong and consistent downward movement. But a crack shows up in the down move when the pattern is seen. With each new candlestick that is formed in the pattern, the downtrend loses strength. The momentum of the bears deteriorates as the candlesticks get shorter and shorter, reducing the power of the downward movement.
Sure, each new day closes lower than the day before it, but the bears are making less progress than they were initially because every new candlestick in the pattern is engulfed by the one before it. Thus, the pattern indicates that the prevailing downswing will change direction and start a new upswing. In other words, the pattern shows that the bulls can come in at any time to push up the price again.
However, most traders look for confirmation after the pattern appears, which, in this case, would be the price moving higher following the pattern, since that is what the pattern is supposed to indicate. Thus, if the candlestick following the pattern closes bullishly and may be even above the third candlestick in the pattern, the pattern is confirmed. However, if the price drops following the pattern, it is not a bullish reversal, but rather a bearish continuation pattern.
In practice, however, it is difficult to find this pattern on charts, and the reversals can also be relatively muted — that is, a little upward price move following the pattern, which is far less than the normal rally expected. Note that the Three Stars in the South pattern doesn’t have a profit objective. So, even if it works and the price rises following the pattern, there is no indication of how far it will rise.
You could use the pattern, if it occurs in the right setting, as a signal to initiate a long position, but make sure that the next price bar confirms the signal first. Moreover, you have to use other trading tools and indicators to support a reversal expectation. For instance, if a stock is trending higher but has recently experienced a pullback to a support level, you could look for a Three Stars in the South pattern knowing that the level is an important price reversal level. But the next price bar after the Three Star in the South pattern must be bullish to confirm the reversal.
The psychology of the Three Stars in the South pattern
We know that the bears and bulls are in a battle to control and dominate the market and whoever wins the battle determines the direction the price would take. In the case of the Three Stars in the South pattern, the bears were already in control, pushing the price lower, but on getting to a demand zone (support level) with lots of buy limit orders, a fresh tussle ensures.
On the first day, bears had a good time, with a sizeable drop in price as confirmed by the size of the first candlestick in the pattern. The bulls can only draw slight optimism from the fact that the candlestick closed a bit far from the low, giving it a long lower shadow, which is a sign of price rejection. On the second day, the bulls started the show by bidding the market to open higher than the low of the first day, but the bears forced the market to close lower than the open. However, bears failed to post a new low.
Interestingly, on the third day, the market opens higher than the previous day’s close in a show of renewed bull commitment, but the price drops again to close below the previous day’s close. However, bears fail to drop the price to a new low once again, indicating that their selling power has reduced. In essence, the bears have not managed to gain new grounds since the first day. This shows that they don’t have what it takes to clear all the buy limit orders lying in wait at that level and that new buy market orders are also coming in.
Meanwhile, as bears are showing exhaustion, buying enthusiasm is gradually increasing by the day. This is reflected by the long lower shadow of the first day, the higher opening prices (compared to the preceding day’s closing prices) on the subsequent days, and the rising daily lows. The higher lows cause uneasiness among bears. Also, the last day of the pattern reflects market indecision with hardly any price movement. Sellers are now ready to cover positions if they see anything in the upside, but the expected rally can only commence if the price moves higher following the pattern. While everything points out that the tide is slowly turning towards the bulls’ side, the next candlestick after the pattern needs to be bullish to confirm a bullish reversal signal.
How to trade the Three Stars in the South pattern
To start with, I must say that this pattern is very rare, but when you see it, trade it like you would trade any other reversal candlestick pattern. Thus, the Three Stars in the South pattern can only serve as a trade trigger when other criteria for a good trade setup are present:
- A favorable market structure — an uptrend or a range-bound market
- An important price level
So, to trade this pattern, you need tools for identifying these supporting factors. Some of the common tools you can use include:
- Trend lines
- Support and resistance levels
- Long-period moving averages
Trend lines
Trend lines help you to confirm the direction of the trend, and in this case, you want the market to be in an uptrend. In addition to confirming an uptrend, trend lines can also act as a rising support level, where the price is likely to reverse. In an up-trending market, attach the trend line to the lows of the pullbacks (downward price swings). This way, they act as rising potential support levels for future downswings. There is a higher chance of price reversal around those levels, and a Three Stars in the South pattern occurring around there is likely to lead to a big price swing up.
Support levels
Support levels are demand zones with lots of buy orders. A pullback to a support level is highly likely to reverse and begin a new upswing. When you see a candlestick pattern, such as the Three Stars in the South pattern, at such an important level, it signals the emergence of a new price swing up. Support levels are the key levels to trade the pattern both in an uptrend and a range-bound market.
Long-period moving averages
You can use a long-period moving average, such as the 200-day, 100-day, or 50-day moving average, to identify the direction of the trend as well as decipher potential support levels. A setup that occurs around a moving average line is likely going to bring a reversal and the continuation of the trend. So, if you can see the Three Stars in the South pattern around a moving average, it has a higher odd of success.
Trading with the Three Stars in the South pattern
Putting it all together, to trade the pattern, you have to confirm that the market condition is suitable and that the pattern is formed at a strong support level. For example, an up-trending market that pulls back to a support level, trend line, or moving average and then forms the Three Stars in the South pattern is a good setup for a long position. You enter at the close of the bullish candlestick following the pattern and place your stop loss below the swing low and your profit target just before the nearest resistance level.
Another good setup would be when the pattern forms at the lower boundary of a range-bound market. In this case, the pattern is signaling the emergence of a new upward price swing after the downswing to the lower boundary. When trading this setup, you enter your trade at the close of the next bullish candlestick and put your stop loss below the swing low and your profit target just before the upper boundary.

The difference between the Three Stars in the South pattern and the Three Black Crows pattern
Yes, both patterns have ‘Three’ in their names and also consist of three candlesticks, but they are completely different and even show different signals. While the Three Stars in the South pattern occurs after a price decline and indicates bullish reversal, the Three Black Crows pattern is a bearish reversal pattern coming after a price advance.
The Three Black Crows pattern is formed by three long black (down) candles, with the second and third candles opening within the real body of the prior candle and closing lower than they opened and below the prior close. It occurs after an upward price swing.
Drawbacks of the Three Stars in the South trading pattern
One of the main limitations of the Three Stars in the South pattern is that it is very rare because of the stringent criteria for defining it. Another one is that the pattern does not have a profit objective; hence, it is up to the trader to determine how they will exit a profitable trade. Moreover, doesn’t tend to produce big moves, which means it may not be particularly useful for trading purposes.
Final words
The Three Stars in the South pattern is a rare bullish reversal candlestick pattern, but if you see it, trade it like any other reversal candlestick pattern. While you can learn to trade on your own, you will learn faster if you enroll in a swing trading course.
FAQ
Where does the Three Stars in the South pattern typically occur?
The Three Stars in the South is a rare bullish reversal pattern comprising three consecutive bearish candlesticks. It appears after a price decline, signaling a potential reversal as the downtrend loses momentum. The pattern is observed in a downtrend, a prolonged pullback in an uptrend, or the downward swing in a range-bound market. It suggests a gradual loss of bearish momentum.
How is the Three Stars in the South pattern identified?
The first candlestick has a long bearish body with a long lower shadow, followed by a shorter second candle opening below the first’s open. The third candle is a small bearish marubozu within the range of the second candle. The pattern suggests that the bears are losing momentum as each candlestick has consecutively higher lows. Although each day closes lower, the downtrend weakens, hinting at a potential reversal to an uptrend.
How can traders use the Three Stars in the South pattern for trading?
The pattern can serve as a trade trigger when other criteria are met, such as a favorable market structure (uptrend or range-bound) and an important price level. Traders can enter long positions if the pattern forms around a support level or trend line in an uptrend. Traders can use tools like trend lines, support and resistance levels, and long-period moving averages to confirm the direction of the trend and identify potential reversal points.