Upside Gap Two Crows: Candlestick Pattern
Candlesticks are some of the most popular solutions to chart the price of a security. With their colorful bodies and long wicks, they make spotting candlestick patterns much easier. One such candlestick pattern is the upside gap two crows.
Key Takeaways
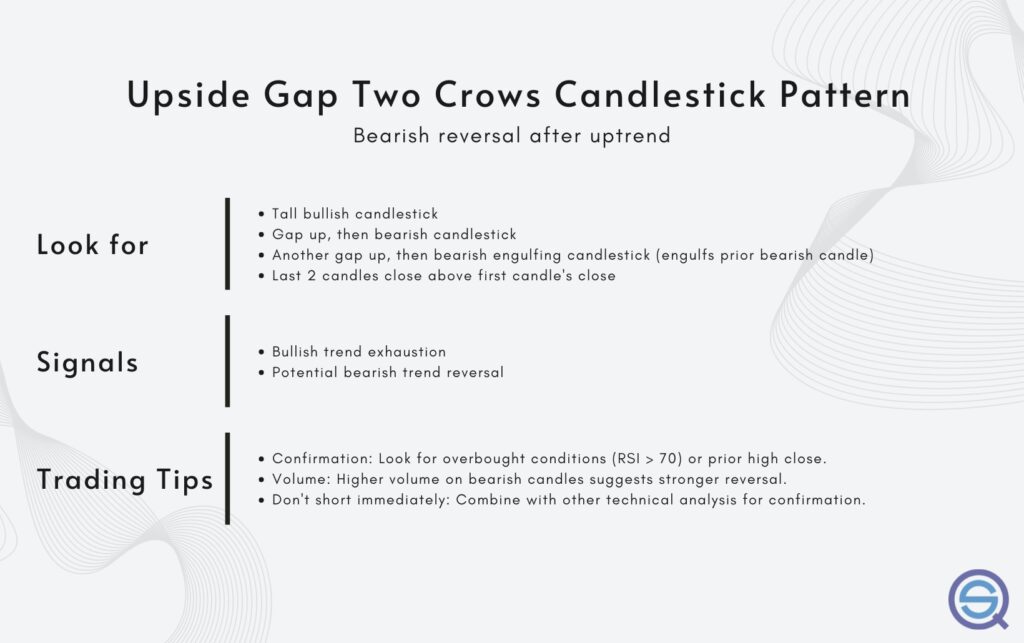
- Three-candle bearish reversal pattern in uptrend.
- First candle strong bullish, confirming ongoing trend.
- Two bearish candles gap upward consecutively.
- Third candle engulfs second, showing strong selling.
- Signals weakening bulls and potential trend reversal.
- Works best with overbought and volume confirmation.
- Avoid trading without additional technical confirmation signals.
- Backtesting improves strategy reliability and performance.
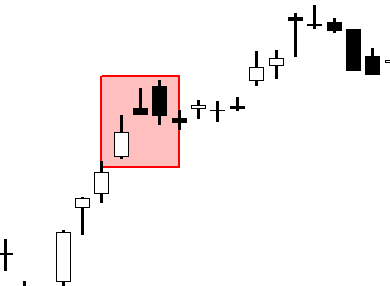
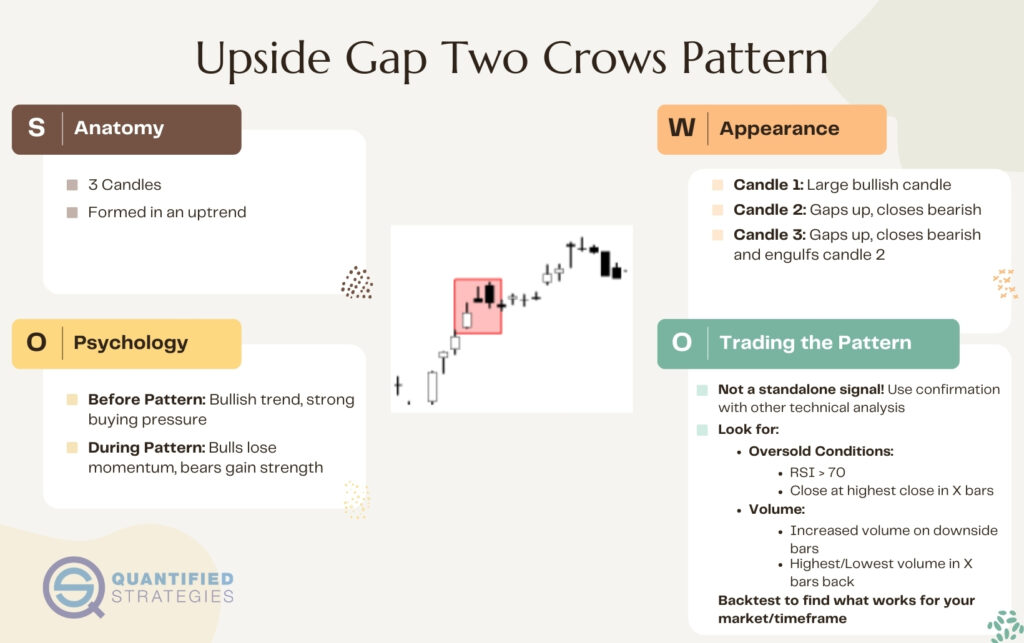
Upside gap two crows is a bearish reversal candlestick pattern that forms in an uptrend, and warns that the trend has come to an end. The pattern consists of three candles, with the first one being bullish and followed by two bearish candles that gap up.
this guide to the upside gap two crows, you’ll learn everything you need to know about the pattern. We’ll guide you to its definition, meaning, and a couple of trading strategies.
Let’s start!
Upside Gap Two Crows Definition
The Upside Gap Two Crows consists of three candles and forms in a bullish trend. Here is the exact definition:
- The first candle is bullish and quite tall
- The second candle gaps up, but finishes as a bearish candle.
- The third candle gaps up above the open of the previous bar, but closes below its close. Thus, it completely engulfs the previous bar.
- While the last two candles are bearish, they still close above the close of the first, bullish candle.
The general view of the upside gap two crows is that it precedes a bearish trend reversal, warning that the current bullish trend has come to an end.
What Does the Upside Gap Two Crows Tell Us About The Market
Every candlestick pattern holds its own unique story about the forces that shaped the market. And while it may be hard to know exactly what happened, watching and analyzing price data is a great exercise to improve your understanding of the markets.
So, let’s analyze the Upside Gap Two Crows!
As the market comes from a bullish trend, market sentiment is mostly bullish. This means that there is a lot of buying pressure, which in turn pushes the market higher, forming the first bullish candle of the pattern.
The bullish sentiment spills over to the next trading session, as the market opens with a big positive gap.
However, bears are getting exhausted from having pushed the market up for an extended period of time. This becomes evident quite quickly, as the market heads down headfirst and finishes the candle in negative territory, despite the initial positive gap.
However, bulls haven’t given up just yet. The remaining bullish market players make a last attempt to push the market upwards, resulting in the subsequent positive gap.
Despite the positive gap, bearish market forces set in once again, this time with even more force. This becomes apparent from the fact that the market this time manages to produce a bearish candle that engulfs the previous bearish candle. This becomes the final evidence that the bullish forces have run out of power, and that the market is most likely to turn bearish!
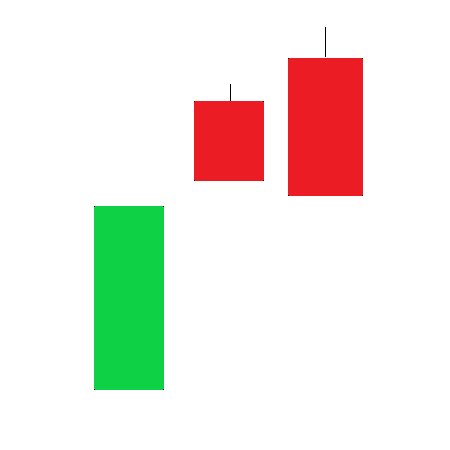
Upside Gap Two Crows Example
Here follows a real example of the pattern:
How to Trade the Upside Gap Two Crows
While many new traders would try and short the markets immediately after learning about a pattern like the upside gap two crows, that’s far from a good idea. Most candlestick patterns need to be used together with other forms of technical analysis to confirm that a certain price move really is likely to happen!
So, let’s take a closer look at some ways you can make the upside gap two crows worthwhile in your trading!
Oversold Conditions
One way to ensure that the market is about the turn around as it forms a bearish reversal pattern, is to see if it’s overbought. Quite a lot of markets, and in particular stocks, show quite strong mean-reverting tendencies. This means that they perform exaggerated moves in either direction which are then corrected by a move in the opposite direction. As a result, these markets tend to become overbought, meaning that they have gone up so much that they soon will turn around.
So how do you define when a market has gone up too much?
Well, there are some ways that are more common than others. Let’s take a look at the two most common methods.
- RSI- Using the RSI indicator to define when a market has gone up too much is an old and proven method. You simply define an overbought market as the RSI being over 70, which is in line with the general interpretation of the indicator. If you want to learn more about how to use the RSI in trading, we highly recommend our definitive guide to the RSI.
- Close Being Highest Close – Another common method is to demand that the market performs its highest close or open a certain number of bars back. This also is the definition that’s used by the double seven trading strategy.
Volume
Another powerful method is to use volume conditions, which give us a better view of what’s happening inside the market.
For example, if the volume of a market increases, it shows that more transactions were there to back up a move, which becomes more significant at least in theory.
Here follow some of our favorite volume conditions:
- Often we just compare the volume of the current candle to the volume of the preceding candle. That way we can tell if volume is high or low relative to previous readings.
- Other times we demand that volume needs to be at its highest or lowest reading x-bars back.
As always, experiment freely using backtesting, and you’ll hopefully soon find something that works.
Upside Gap Two Crows Trading Strategies
Having had a look at volume and overbought markets, we’ll now go on to trading strategies that rely on the bullish upside gap two crows.
Just remember that these strategies need to be applied to the right market and timeframe to stand a chance. Despite what many believe, all candlestick patterns aren’t universal in the sense that they work on any market or timeframe. Quite on the contrary, you have to focus on the markets and timeframes that work best with your pattern, to improve your odds of success!
With this said, you’ll be introduced to two example strategies below. Both are great examples of how we would go about to start building a trading strategy consisting of the upside gap two crows.
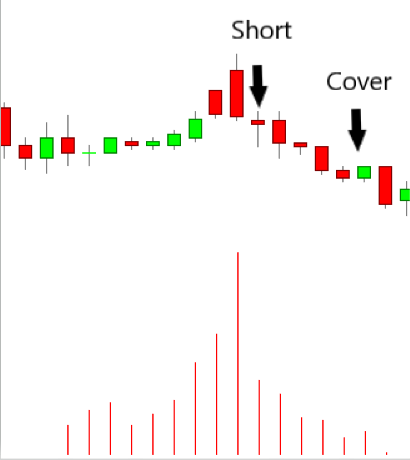
Trading Strategy 1: Upside Gap Two Crows and Volume Condition
Earlier in the article, we had a look at using volume conditions to improve the two crows pattern. However, the conditions we covered were quite generic, so in this strategy example, we’ll instead try to create some special conditions with the anatomy of the upside gap two crows in mind.
We’ll demand that the last bearish candle was formed with much more volume than the first bullish candle. If the condition is true, we assume that the market is getting more bearish, since it fell even if a lot of transactions took place.
So, the rules to go short become that:
- There is an upside gap two crows
- The volume of the last bearish candle is at least 1,5 times that of the first bullish candle.
To exit the trade, we wait for 5 bars.
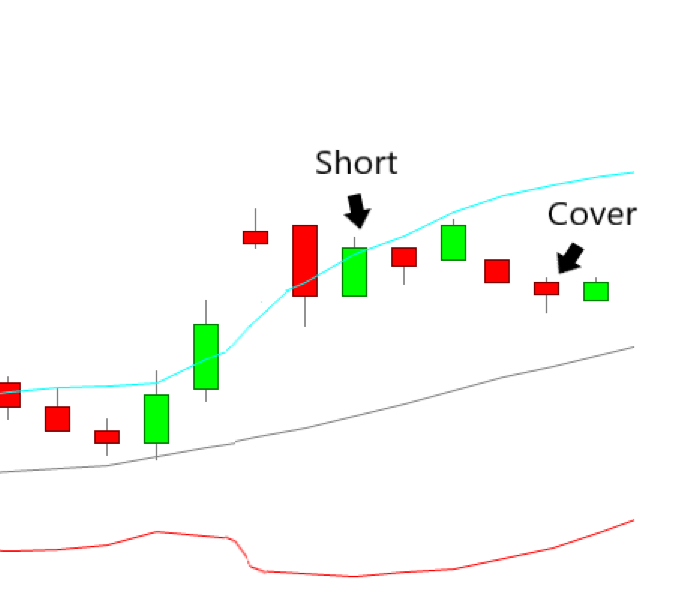
Trading Strategy 2: Upside Gap Two Crows and Bollinger Bands
One way to define that a market has become overbought, is that it trades above the upper bollinger band.
Bollinger bands is a trading indicator that consists of a moving average, around which one line is drawn on either side, 2 standard deviations away. This way the outer bands contract and expand with the changes in volatility
Now, since a market that’s overbought is more likely to turn bearish, we’ll require that the upside gap two crows is formed above the upper bollinger band.

In other words, the rules to go short become:
- There is an upside gap two crows
- The close of the middle candle is above the upper bollinger band
Then we once again exit the trade after 5 bars.
Ending Words
In this candlestick pattern guide, you’ve got to learn the definition and meaning of the upside gap two crows. You’ve also learned some powerful techniques to filter out bad trades, involving volume and overbought conditions.
Now, learning candlestick patterns and their traditional meaning won’t be enough to become a profitable trader. Instead, you’ll have to learn to analyze the markets yourself to come up with what works and not.
Here you can find our Candlestick pattern archive with many articles covering the subject.
FAQ
How is the upside gap two crows pattern defined?
The pattern includes a tall bullish candle, a second bearish candle that gaps up, and a third bearish candle that gaps up above the open of the previous bar but closes below its close. The last two candles completely engulf the first bullish candle.
How can oversold conditions be used to confirm the upside gap two crows pattern?
Oversold conditions can be identified using indicators like RSI (Relative Strength Index). If a market is considered overbought (RSI above 70), it may be more prone to a reversal, complementing the bearish nature of the upside gap two crows.
How does volume play a role in confirming the upside gap two crows pattern?
Volume conditions can provide insights into the strength of market moves. In a strategy, comparing the volume of the last bearish candle to the first bullish candle helps assess bearish momentum. More bearish volume may indicate a stronger shift.