Heikin Ashi Trading Strategy (Backtest, Settings & Trading Rules)
Heikin Ashi are a modified price representation designed to filter out market noise and highlight trend direction more clearly than traditional Japanese candlesticks. Originally introduced to Western markets in the 1990s, this charting technique has become popular among traders looking to identify sustained trends and consolidation phases with greater precision. The Heikin-Ashi technique was developed by Munehisa Homma in the 1700s.
In this article, we analyze how Heikin Ashi works and whether it can be used to build a reliable trading system. Heikin Ashi charts are commonly used to analyze various financial instruments such as stocks, futures, and forex. The focus is on developing and evaluating a rules-based Heikin Ashi trading strategy through backtesting, with the goal of determining its real performance across historical data.
We also apply additional filters to improve signal quality and test whether Heikin Ashi can function as a standalone trading strategy. The results provide insight into its strengths, limitations, and practical use in algorithmic trading.
Introduction to Heikin Ashi
Heikin Ashi charts are a powerful tool in technical analysis, designed to help traders identify market trends and minimize the distractions of market noise. The term “Heikin Ashi” translates to “average bar” in Japanese, which reflects the chart’s unique approach of using average price data to represent price movements.
Unlike traditional candlestick charts that plot actual open, high, low, and close prices, Heikin Ashi charts use a modified formula that blends price data from both the current and previous periods. This results in Heikin Ashi candles that provide a smoother, more consistent view of market trends.
By focusing on the average price rather than individual price swings, Heikin Ashi charts make it easier for traders to spot trends and potential reversals. The visual simplicity, typically green candles for uptrends and red candles for downtrends, helps traders quickly assess the overall direction of the market. This clarity is especially valuable in volatile markets, where regular candlestick charts can be cluttered with false signals and erratic price movements.
By reducing market noise, Heikin Ashi charts allow traders to make more informed decisions and develop trading strategies that are better aligned with prevailing market trends.
What is Heikin Ashi Candlestick?
The name implies it originates from Japan. As it turns out, Heikin Ashi candlesticks are another version of the famous Japanese candlesticks used in all our charting. Presumably, Heikin Ashi means “average bar” in Japanese, which sums up the difference between the two forms of candlesticks.
There are a few differences between Heikin Ashi and traditional candlesticks. Candlesticks show the daily price action of the open, high, low, and close, while Heikin Ashi aims to indicate the trend by smoothing the price movements.
On a normal candlestick chart, each candlestick displays the actual open, high, low, and close prices for the period, and normal candlesticks alternate colors with each price change, reflecting real-time market movements. In contrast, Heikin Ashi charts tend to stay the same color for longer periods compared to traditional charts, making trends easier to spot.
Heikin Ashi is, to our understanding, used mainly as a supplement for other indicators, something we will test further down in the article.
Western trading owes much to Japanese trading. For example, the candlestick price representation is Japanese, imported to the West around the 1980s. Since the second half of the 1990s, a new “candlestick” representation was imported from Japan to the West, largely thanks to an article written by trader Dan Valcu in 2004. This price representation is called Heikin-Ashi, which means Average-Bar.
Heikin Ashi candlesticks aim to eliminate the “noise” in the prices to bring out the directional component or the consolidation phases. The Heikin-Ashi method has obtained tremendous popularity on the web, but if it is not understood thoroughly, it can lead to trading mistakes.
First, the Heikin-Ashi do not show the real prices, so it is impossible to trade directly on them. The four prices that characterize the candle are not real prices. Something similar also happens with other charting techniques, such as the one called Range Bar and the one called Renko, which you can learn more about in these articles:
When performing technical analysis, choosing the appropriate chart type is important, as different chart types like Heikin Ashi or normal candlestick charts can help traders identify trends, reversals, and key support and resistance levels.
To understand the difference, we need to look at how it’s calculated:
How to calculate the average price formula for Heikin Ashi
To calculate the formula for Heikin Ashi is not straightforward and can be a bit complicated.
Heikin Ashi smooths the candlesticks using average open, high, low, and close values. However, the heikin ashi open and heikin ashi close are calculated differently for Heikin Ashi – it’s not the actual prints, but a mathematical formula is used to make “artificial” values.
As mentioned, the popularity of the Heikin-Ashi method in the West is largely due to trader Dan Valcu, who described it in 2004 in an article that appeared in the famous Stocks & Commodities magazine. In this article, he wrote that the Heikin-Ashi values are calculated as follows:
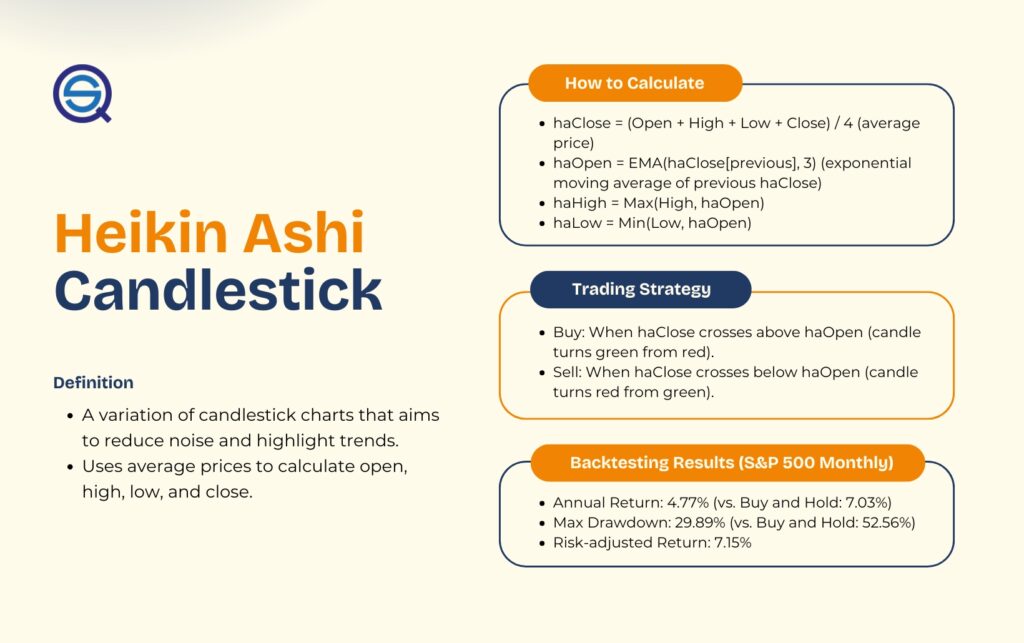
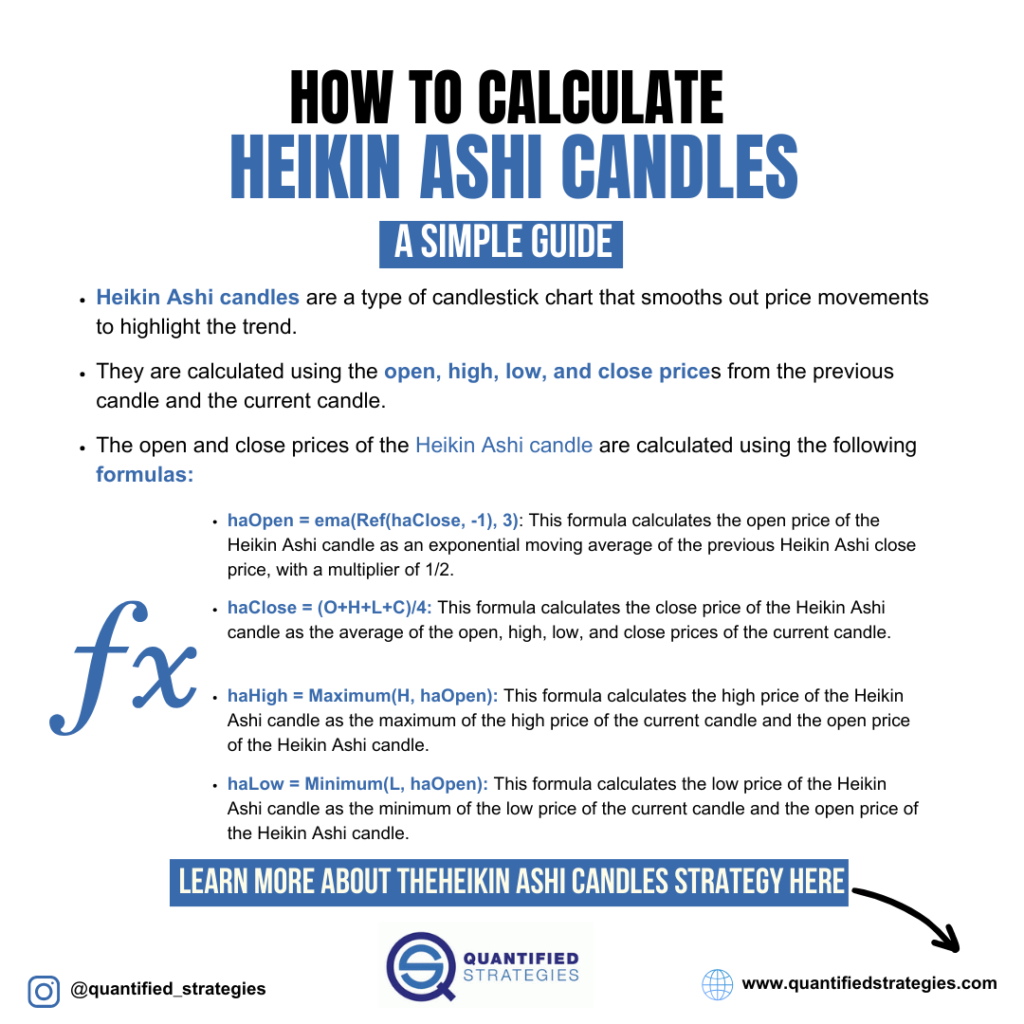
- heikin ashi close = (O+H+L+C)/4;
- heikin ashi open = (previous bar’s heikin ashi open + previous bar’s heikin ashi close) / 2;
- heikin ashi high = highest value among the current bar’s high, heikin ashi open, and heikin ashi close;
- heikin ashi low = lowest value among the current bar’s low, heikin ashi open, and heikin ashi close;
The heikin ashi open is derived from the midpoint of the previous bar’s open and close, referencing the previous period to ensure continuity and smoothing of the trend analysis. These formulas use data from both the previous bar and the current bar to smooth price action and provide clearer trend signals.
The HAO price is dependent on the previous Heikin Ashi values. Because the open price is the midpoint of the “body” of the previous candle, every Heikin Ashi candle starts at the midpoint of the previous one.
Traders use visual cues like the presence or absence of wicks (shadows) on Heikin Ashi candles to identify trend strength and potential reversals.
These formulas have been taken for granted for twenty years without realizing that they can be simplified and better understood. Let’s see how and why.
Since heikin ashi close is always between H and L, then formulas 3 and 4 are more simply equivalent to the following:
- heikin ashi high = Maximum(H, heikin ashi open, heikin ashi close)
- heikin ashi low = Minimum(L, heikin ashi open, heikin ashi close)
In all these years, no one has noticed this similarity!
Another thing mentioned is the true meaning of heikin ashi open. heikin ashi open is actually an exponential moving average of the previous heikin ashi close calculated with a multiplier of 1/2. The formula to get the periods from the multiplier is
Periods = (2 / Multiplier) – 1
so the periods are equal to 3.
Is Heikin Ashi better than candlesticks?
Heikin-Ashi is a technical indicator plotted as candlesticks, more precisely:
• haClose is the so-called Total Price (the average of the four prices of a candle)
• haOpen is an exponential moving average of the total price
• haHigh and haLow act as resistance and support.
Regular candlesticks are widely used in technical analysis, often in combination with indicators like moving averages and MACD, to confirm trade signals and improve entry and exit timing, especially in trend-following and swing trading strategies.
Heikin Ashi is best suited for trending markets and may produce false signals in sideways or choppy markets.
We, therefore, believe that the question of which is better is “nonsense”: candlesticks are about real prices, and Heikin-Ashi is a technical indicator derived from prices and plotted as candlesticks. We will understand this better in the following section.
What does the Heikin Ashi candlesticks look like?
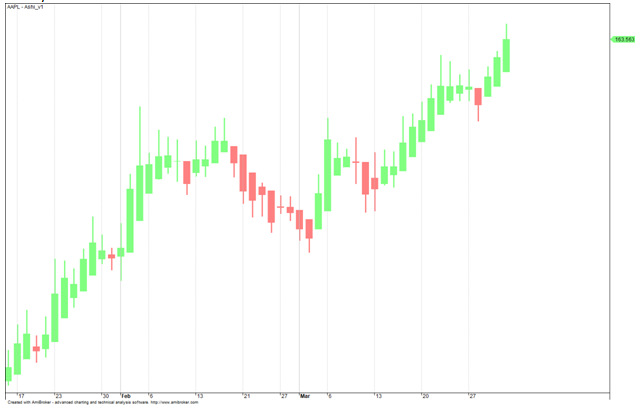
Below is the S&P 500 with standard candlesticks and Heikin Ashi. In the image, you can see a Heikin-Ashi chart. It looks excellent, seems very easy to trade, and you can make a lot of money:
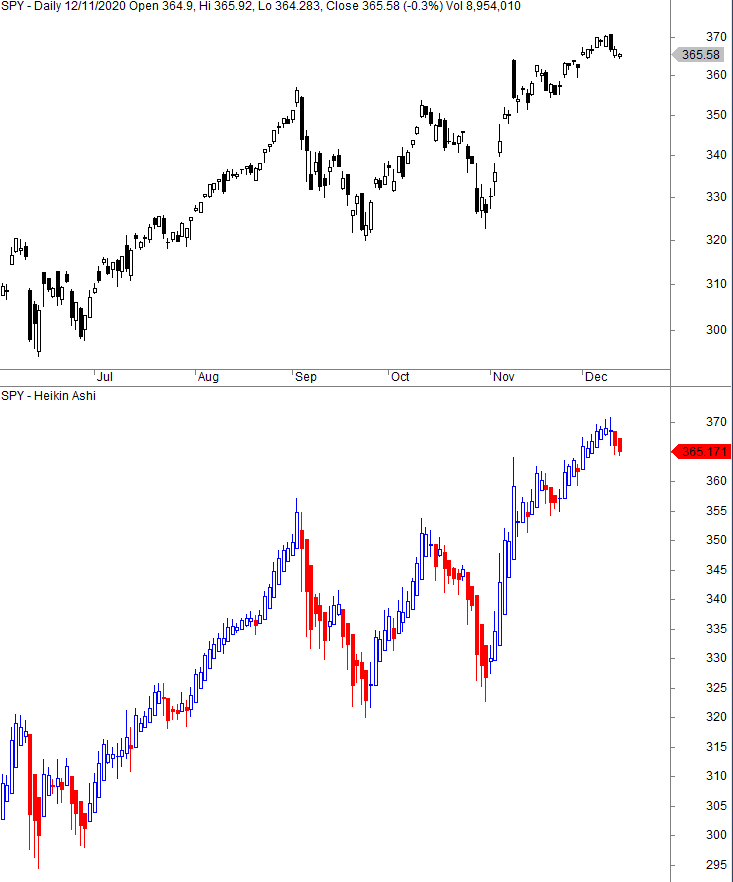
The lower half, which contains the Heikin Ashi, shows blue and red candlesticks. Blue signals a positive trend, while red is bearish. A black and filled candlestick in the upper half doesn’t necessarily translate into a red Heikin Ashi candle.
On Heikin-Ashi charts, a series of consecutive candles of the same color often indicates a strong trend, making it easier to spot sustained moves. Traders typically stay in a trade as long as the Heikin-Ashi candles remain the same color, exiting when the color changes, as this may signal a trend reversal.
The main idea with Heikin Ashi candlesticks is to smooth the movements into more reliable trends. The Heikin Ashi above shows fewer blue to red changes than black and white in the original candlestick chart. Blue and red candles flow in patterns or show regularities and trends – at least to the naked eye.
Another significant difference is that Heikin Ashi doesn’t offer price gaps. Additionally, the price scale on Heikin-Ashi charts may display both the calculated average price and the actual market price, whereas standard candlestick charts show only the current market price on the Y-axis.
However, what seems orderly and trending, might not be obvious when we test some quantifiable rules.
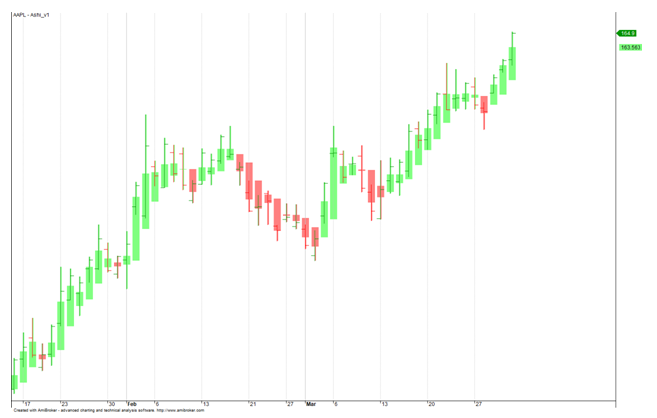
Here are a couple of other Heikin Ashi charts:
If you trade on a candle’s opening or closing price, your trade will not be executed at the Heikin-Ashi price. As evident from the charts above, the actual opening and closing prices can be very far from the ones plotted by Heikin-Ashi. This is because the current price shown on a Heikin-Ashi chart is an average and may not match the actual market trading price due to the averaging process.
You can see it in the following image, where there are the same Heikin-Ashi candles as in the previous image, with the real prices plotted as overlapping bars. The one sure thing is that Heikin-Ashi always packs the actual bar.
The chart below has Heinin Ashi bars and ordinary bars to spot the difference:
What does Heikin Ashi indicate?
Heikin-Ashi, as the Japanese name itself states, is an average bar. Each bar price is an average price, and you can’t trade on the price (or bar). So the indications it gives us are delayed.
Precisely because it’s delayed, it manages to visualize the price trend well and can be a valuable tool for analysts and discretionary traders for trend following strategies. Heikin Ashi charts help traders identify trends and trend changes by smoothing out price data, making it easier to spot ongoing market movements. This is especially useful in trending markets, where Heikin Ashi clarifies market movements and helps traders make informed decisions.
The arguments for consecutive colored candles seem apparent, but as with any other indicator, Heikin Ashi tells us what has happened in the past. Traders often look for a shift from red to green candles to confirm a new direction, and small-bodied candles with long wicks can signal potential trend changes. Does it offer any benefits in predicting future movements?
First, let’s make a customization:
Customizable Heikin-Ashi representation
Since we have understood what the Heikin Ashi technique really is and how to calculate it, we can also propose changing the parameter that regulates the calculation of the Open to filter out more or less noise in the price. Successful Heikin Ashi trading involves filtering market noise and confirming reversals by observing consecutive same-colored candles.
haOpen = ema(Ref(haClose, -1), 3);
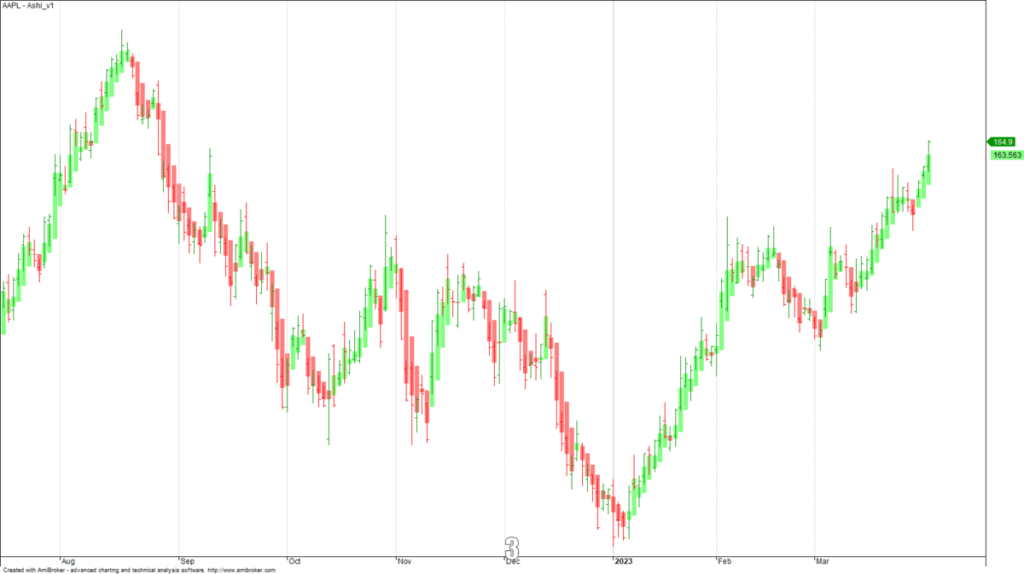
The following image shows how a Heikin-Ashi chart changes when the period’s parameter varies from 2 to 9, while on the web is always 3 (please click on the chart to display animated changes in the parameters).
Does Heikin Ashi contain any predictive value?
We use candlesticks in our charts, not because we look for edges, but because we believe it’s easier to grasp the daily action and where prices opened and closed. However, in a previous article, we revealed that some candlestick formations do seem to offer value:
Technical traders often use Heikin Ashi charts for trend analysis, as the smoothing effect helps to filter out market noise and highlight overall trends. However, traders may find it challenging to identify short-term price movements using Heikin-Ashi charts due to their smoothing effect. As a result, Heikin-Ashi charts are not ideal for short-term traders who want to take advantage of small or rapid price movements.
Can we get the same promising results using Heikin Ashi?
Heikin Ashi trend following strategy
Now let’s look at a specific and profitable Heikin Ashi trend following strategy. We apply the following rules for generating trading signals and trend identification:
Buy = Cross( haClose, haOpen ); //haClose crosses above haOpen i.e. candle turns green from red
Sell = Cross( haOpen, haClose );//haClose crosses below haOpen i.e. candle turns red from green
Heikin-Ashi is a technical indicator plotted as candlesticks, more precisely:
• haClose is the so-called Total Price (the average of the four prices of a candle)
• haOpen is an exponential moving average of the total price
The code is like this (Amibroker):
HAC = (O + H + L + C)/4;
HAO = AMA( Ref( HAC, -1 ), 0.5 );

Buy = HAC>HAO;
BuyPrice=Close;
Sell = HAC< HAO;
SellPrice = Close;
We use a 10-day exponential average.
This strategy uses ha candlesticks, which help reduce market noise and validate momentum signals. Consecutive ha candlesticks with no wicks on the opposite side indicate strong momentum, which can be useful for confirming trend direction. For better trend identification and confirmation of trading signals, consider using other technical indicators such as moving averages or RSI alongside Heikin Ashi charts.
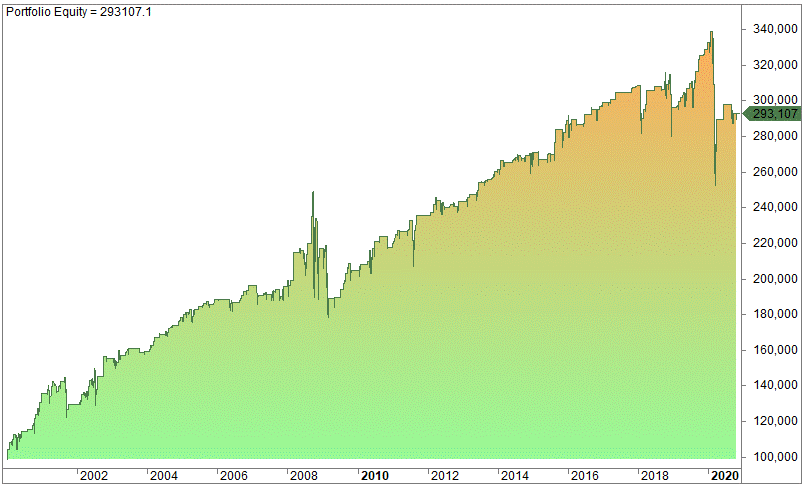
It is a “simple” strategy that we will backtest on the S&P 500 index from 1960 to today, on a monthly time frame.
And this is the resulting equity line:
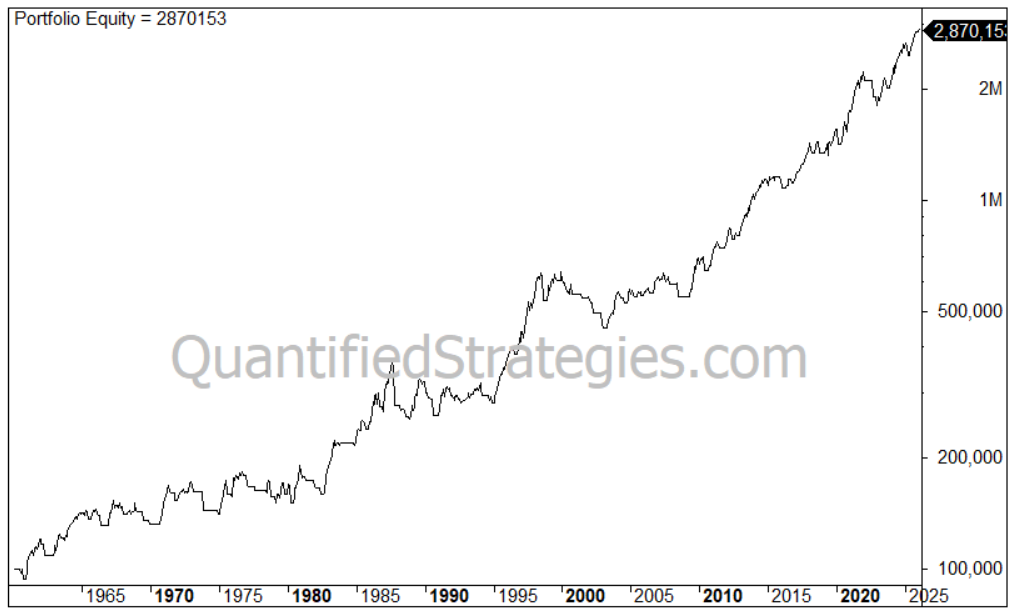
We can think of it as a trend following strategy. We don’t take short trades due to the bullish trend in the stock market (in the long term).
When determining exit points, it’s important to use actual price levels from traditional charts for stop-loss placement, not the averaged HA prices. This is a key aspect of risk management in Heikin Ashi trading. Traders should also consider using other technical analysis tools to confirm trends and reversals.
Let’s analyze the trading statistics and metrics:
- 85 trades since 1960
- Annual Return: 5.2% (buy and hold is 7.5%) – not including dividends
- The average gain per trade is 4.7%
- 52% of the trades are winners
- You are invested 67% of the time
- Max drawdown is 29% (buy and hold 52.56%)
- Risk-adjusted return is 7.3% (5.2% divided by 0.67 – buy and hold 7.03%)
The low win ratio (52%) is typical of a trend-following trading system, but it’s not as low as ours. The performance metrics are good, and given that the Heiki-Ashi were developed long ago, the results can be considered out-of-sample.
Here is the profit/loss distribution. It provides insight into how the trading system works:
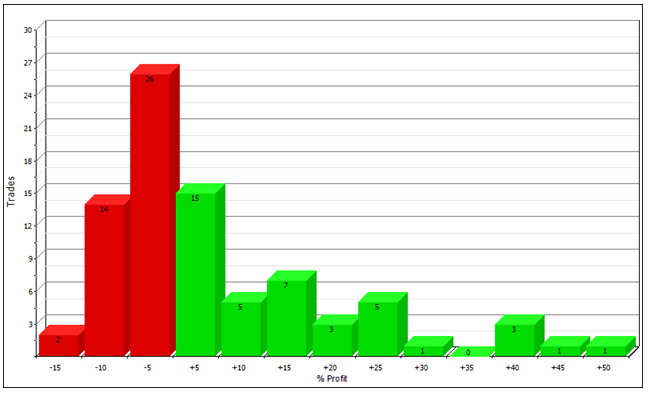
As we might expect, we find a favorable asymmetric profit/loss distribution. The opposite is a negatively skewed profit distribution – typical for a mean reversion strategy
Heikin Ashi and ADX trading strategy
We also tried some trading rules that included the ADX-indicator:
Because stock indices tend to revert to the mean, we backtest by entering at the close after two red Heikin Ashi candles. Additionally, we use an x-day filter of the ADX (test yourself for different parameters). The exit is on a day when the close is higher than yesterday’s high.
On the S&P 500, we get this equity chart:
CAGR is 5.27%, but exposure is only 5% (time spent in the market).
However, consumer staples (XLP) seem much better, but the average per trade is a low 0.22%.
Bearish Trend Analysis
When analyzing bearish trends, Heikin Ashi charts offer a distinct advantage by highlighting sustained downward movements with a series of red candles. In a strong downtrend, Heikin Ashi candles often appear with long bodies and little to no upper shadows, signaling persistent selling pressure.
The Heikin Ashi formula calculates each candle’s close as the average of the current bar’s open, high, low, and close, which smooths out erratic price movements and provides a clearer picture of the overall trend.
Traders use Heikin Ashi charts to identify not only the presence of a bearish trend but also potential points of trend reversal. For instance, a shift from red to green candles may indicate that bearish momentum is fading and a reversal could be imminent.
Additionally, a series of small candles with wicks on both ends often signals market indecision or a possible pause in the trend. To enhance the reliability of these signals, many traders combine Heikin Ashi analysis with other technical analysis tools, such as moving averages and the Relative Strength Index (RSI).
These additional indicators can help confirm the strength of a downtrend or alert traders to potential changes in market direction, making Heikin Ashi charts a valuable component of any comprehensive trading strategy focused on trend analysis.
Heikin Ashi strategy – conclusion:
Heikin Ashi works, but mostly on long time frames. We have shown you several profitable Heikin Ashi strategies and thus given you a greater understanding of Heikin Ashi and what it can do for us. The Heikin-Ashi chart displays a smoother look due to its averaging method, which helps clarify market movements by reducing noise and making trends easier to identify.
Since we are more interested in quantified strategies, we tried backtesting a straightforward strategy and found it works well. We also proposed a way to customize Heikin-Ashi to filter out noise.
Final Thoughts
In summary, Heikin Ashi charts are an essential resource for traders aiming to identify market trends and cut through the noise of volatile price movements. By applying the Heikin Ashi formula and analyzing distinctive candlestick patterns, traders can gain a more accurate perspective on market direction and make smarter trading decisions. Heikin Ashi charts are versatile and can be used across various financial markets, including stocks, forex, and futures, making them suitable for a wide range of trading strategies.
To maximize the effectiveness of Heikin Ashi charts, it’s important to use them alongside other technical analysis tools, such as moving averages, RSI, and volume indicators.
This multi-faceted approach helps confirm signals, spot trends, and identify potential reversals with greater confidence. Whether you’re a trend trader or a technical analyst, incorporating Heikin Ashi charts into your trading routine can provide a competitive edge and improve your overall trading performance.
Remember, staying informed about market trends and continuously refining your trading strategy with tools like Heikin Ashi is key to long-term success in the financial markets.
FAQ:
What is Heikin Ashi candlesticks?
Heikin Ashi is a Japanese candlestick charting technique aimed at highlighting trends or consolidation phases by smoothing price movements. Unlike traditional candlesticks, Heikin Ashi uses averages, and its representation is designed to reduce noise in price action.
A Heikin Ashi chart shows clearer trend directions and smooths out market noise, making it easier to interpret price movements compared to traditional candlestick charts.
Is Heikin Ashi better than traditional candlesticks, and what are its advantages?
Heikin Ashi and traditional candlesticks serve different purposes. While candlesticks represent real prices, Heikin Ashi is a derived indicator aiming to smooth price movements.
On traditional candlestick charts, the price scale on the Y-axis shows the actual market price, but on Heikin Ashi charts, the price scale may display both the calculated average price and the actual market price, highlighting a key difference in how price information is represented. Heikin Ashi is considered a lagging indicator, offering indications based on past price movements.
What is the profitability of the Heikin Ashi trend-following strategy?
The strategy, being trend-following, is designed to capture prolonged market trends. Trend identification is a key aspect of the Heikin Ashi trading strategy, as it helps traders spot and confirm market trends using visual indicators and price levels. This aligns with the nature of Heikin Ashi, which aims to smooth price movements and highlight trends.
Due to its lagging nature, Heikin Ashi is often used alongside other tools like Moving Averages, RSI, or MACD for confirmation. While the win ratio might seem moderate, the strategy’s overall performance metrics, risk-adjusted return, and positive equity growth make it a noteworthy trend-following approach.
It’s essential to consider that the strategy, like any trading system, has its strengths and limitations. Traders may need to assess its compatibility with their risk tolerance and overall trading objectives.
Heikin Ashi Trading Glossary
- Bullish: A market condition where prices are rising.
- Bearish: A market condition where prices are falling.
- Candlestick: A graphical representation of price movement.
- Doji: A candlestick pattern indicating indecision.
- EMA (Exponential Moving Average): A type of moving average that gives more weight to recent prices.
- Fibonacci Retracement: A tool used to identify potential support and resistance levels.
- Gravestone Doji: A bearish reversal candlestick pattern.
- Hammer: A bullish reversal candlestick pattern.
- Heikin Ashi: A charting technique that uses modified candlesticks to filter noise.
- Ichimoku Cloud: A comprehensive trading indicator.
- Inside Bar: A candlestick pattern indicating consolidation.
- Lagging Indicator: An indicator that follows price movements.
- Leading Indicator: An indicator that predicts future price movements.
- MACD (Moving Average Convergence Divergence): A trend-following momentum indicator.
- Morning Star: A bullish reversal candlestick pattern.
- Moving Average: A statistical calculation of average prices.
- Oscillator: An indicator that oscillates above and below a central line.
- Parabolic SAR: A trend-following indicator.
- Pivot Point: A support and resistance level used in trading.
- Range: The difference between the high and low prices.
- Relative Strength Index (RSI): A momentum oscillator.
- Resistance: A price level where selling pressure is expected.
- Rogue Wave: A rare and strong Heikin Ashi reversal pattern.
- Scalping: A trading strategy focused on small, quick profits.
- Shooting Star: A bearish reversal candlestick pattern.
- Support: A price level where buying interest is expected.
- Swing Trading: A trading strategy that aims to capture short- to medium-term price swings.
- Trendline: A line drawn to represent a trend.
- Volume: The number of shares or contracts traded.
- Whipsaw: A situation where a trader is caught in a series of quick, adverse price movements.
- ADX (Average Directional Index): A trend strength indicator.
- Aroon Oscillator: A momentum oscillator used to identify trend changes.
- Bullish Engulfing: A bullish reversal candlestick pattern.
- Candlestick Pattern: A specific arrangement of candlesticks.
- Dark Cloud Cover: A bearish reversal candlestick pattern.
- Engulfing Pattern: A two-candlestick pattern indicating a potential reversal.
- Fibonacci Extension: A tool used to identify potential price targets.
- Gap: A price jump between two trading sessions.
- Hanging Man: A bearish reversal candlestick pattern.
- Ichimoku Tenkan Sen: The Tenkan Sen line in the Ichimoku Cloud.
- Inverted Hammer: A bullish reversal candlestick pattern.
- Leverage: Borrowed capital used to increase trading position size.
- Margin: Collateral required to trade with leverage.
- Moving Average Crossover: A signal generated when two moving averages cross.
- Piercing Pattern: A bullish reversal candlestick pattern.
- RSI Divergence: A discrepancy between RSI and price movement.
- Scalp Trader: A trader who specializes in scalping.
- Stochastic Oscillator: A momentum indicator measuring overbought and oversold conditions.
- Support and Resistance Zones: Price levels where supply and demand interact.
- VWAP (Volume Weighted Average Price): A trading indicator based on volume and price.