

2 Price Action Trading Strategies With Small Drawdowns

Today, we look at 2 price action strategies. One is for stocks (SPY), and one is for gold (GLD).
What is price action?
In simple terms, price action means analyzing what the price itself is doing and using that information to anticipate what it may do next.
Let’s go straight to the strategies:
Strategy 1: Price Compression Strategy
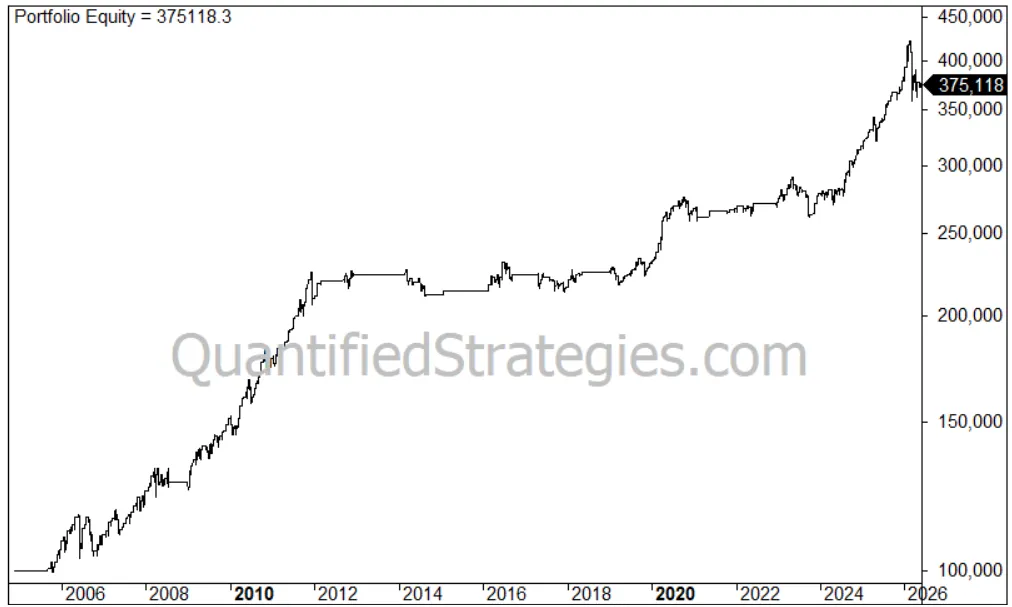
We quantified some trading rules (see rules at the bottom), and we got the following equity curve:
Strategy type: Breakout strategy.
Market: The gold price (GLD).
Performance
- No. of trades: 445
- Average gain per trade: 0.3%
- Win ratio: 71%
- Profit factor: 2
- Annual returns (CAGR): 6.3%
- Exposure/time in the market: 21%
- Risk-adjusted return: 29% (CAGR divided by time spent in the market (0.21))
- Max drawdown: 15%
The upside is that the strategy can be further improved with a better trend filter.
Strategy 2: Turnaround Tuesday
The strategy has worked well for the S&P 500 over four decades, including the 2008 financial crisis, so this time we backtest SSO. SSO is the ticker code for an ETF that uses 2x leverage for the S&P 500, so beware the risks.
This is the performance:
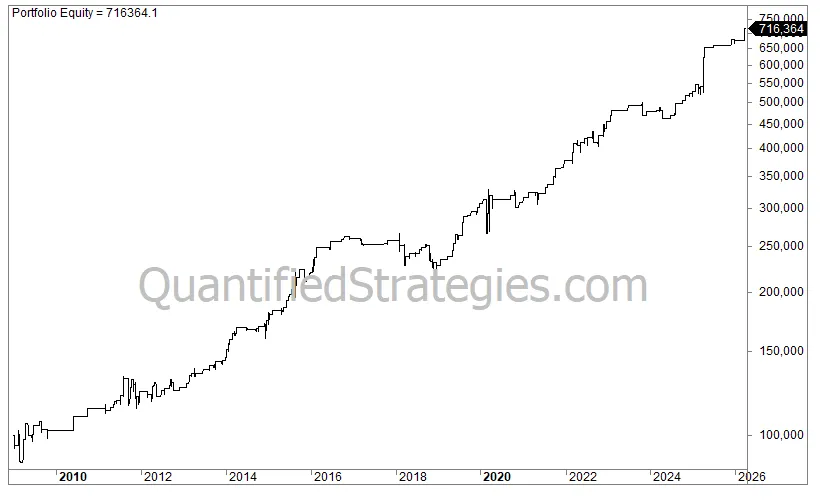
- No. of trades: 181
- Average gain per trade: 1.2%
- Win ratio: 70%
- Profit factor: 2.5
- Annual returns (CAGR): 12%
- Exposure/time in the market: 10%
- Risk-adjusted return: 111% (CAGR divided by time spent in the market (0.1))
- Max drawdown: 18% (buy and hold 59%)
Trading Rules
We backtested the following trading rules: