

S&P 500 Mean Reversion Using IBS and RSI 2026 – Backtest and Trading Rules

Below is a trading strategy backtested on SPY or the S&P 500:
The classical mean reversion strategy in the S&P 500
In plain English the strategy reads like this:
Trading Rules
You find the trading rules at the bottom of the article
Key Takeaways
- Strategy targets short-term S&P 500 mean reversion
- Uses IBS and RSI for oversold conditions
- Trades are entered at daily close
- Exit occurs after first positive close
- Compounding significantly boosts long-term equity growth
- Inverting strategy parameters performs poorly
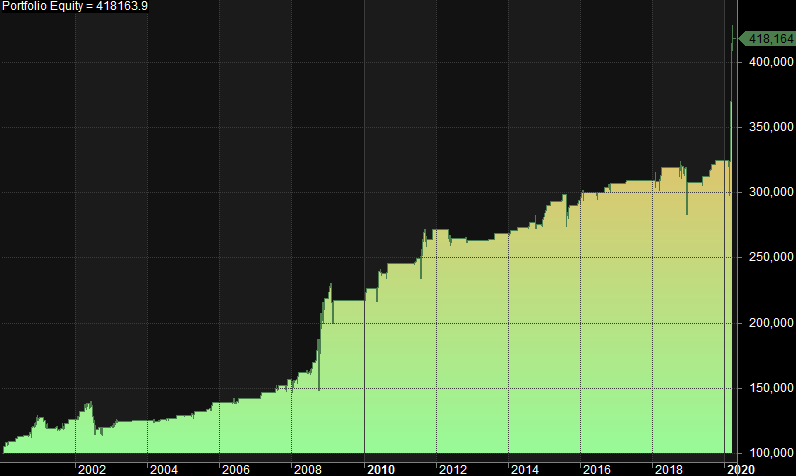
The equity curve since January 2000 looks like this (starting with 100 000 in equity and allocating 100% of equity to every trade, ie. compounding, but taxes are not deducted):
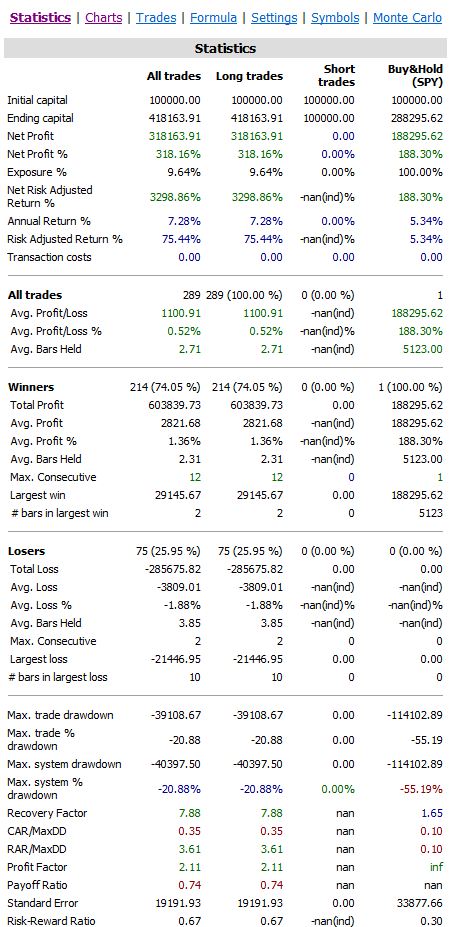
The stats are like this:
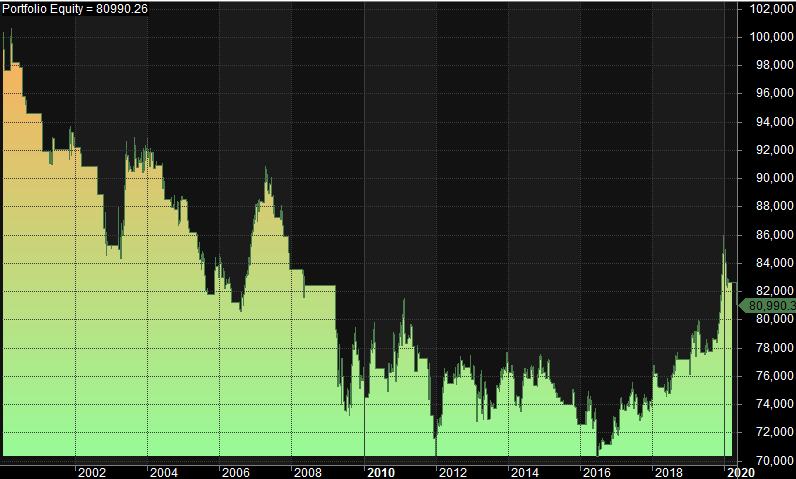
How does the strategy perform if we invert it, ie. reversing the parameters? This is how the equity line performs:
——————————
If you would like to have the Amibroker and Tradestation code for this strategy plus 70+ other free trading strategies published on this website, please click on this link:

For more trading strategies, please click here:
- Free trading strategies
- Monthly trading edges (subscription service)
FAQ:
– What is the classical mean reversion strategy in the S&P 500?
The classical mean reversion strategy in the S&P 500 involves specific criteria based on Internal Bar Strength (IBS) and Relative Strength Index (RSI) to determine trading signals.
– What are the statistical results and performance of this mean reversion strategy in the S&P 500?
The strategy’s performance can be analyzed using various statistical measures, including win rates, drawdowns (periods of losses), and annual returns. These metrics provide insights into the historical performance of the strategy.
– How does the strategy perform if you invert the parameters or reverse the conditions?
The article includes an equity curve that demonstrates the performance of the strategy when the parameters are reversed or inverted. This information can help traders understand the importance of the chosen criteria.