Acceleration Bands (Trading Strategy)
What are the Acceleration Bands?
Acceleration Bands refer to a technical indicator plotted as an overlay on the price chart to show the direction of the trend and the momentum of the price action. Like the Bollinger Bands, the acceleration bands indicator consists of three bands – an upper band, a lower band, and a middle line. The middle line is a simple moving average (SMA), while the upper and lower bands are calculated from the range of the current period.
In this post, we will take a look at everything you need to know about this indicator: what it is, how it works, how to backtest it, and how you can improve your trading strategies with it. Read on!
There are several different tools retail and professional traders can use to track the market trends and determine the momentum of the price action — one of them is the Acceleration Bands indicator. What do you know about this indicator?
Key Takeaways
- Acceleration Bands are a price overlay indicator with three lines (upper, lower, and a moving-average middle line) designed to highlight trend direction and price momentum.
- Breakouts above or below the bands can signal accelerating price movement, while the bands may act as dynamic support and resistance in trending markets.
- The indicator adapts to market volatility, with band width expanding during volatile periods and contracting when volatility is low.
- Related reading: List of trading indicators
What Are Acceleration Bands?
Acceleration Bands refer to a technical indicator plotted as an overlay on the price chart to show the direction of the trend and the momentum of the price action. Similar to the Bollinger Bands, the acceleration bands indicator consists of three bands — an upper band, a lower band, and a middle line. The middle line is a simple moving average (SMA) of a chosen number of periods, while the displacement of the upper and lower bands is calculated from the range of the current period.
The indicator was created by Price Headley, and it’s based on using the concept of acceleration to identify when a stock price is about to gain momentum. It plots bands around the price action based on the average trading range such that when the price breaks out of the band, it means that it wants to accelerate in the direction of that breakout. Depending on the direction of the trend, the upper and lower bands can serve as dynamic resistance and support levels respectively.
Since the bands are plotted based on the price range, traders not only use the indicator to identify the momentum of the price action but also gauge the volatility in the market. Just like the Bollinger Bands, the acceleration bands indicator dynamically adjusts the width of the bands in line with the market volatility such that, during periods of high volatility, the width widens, and during periods of low volatility, it narrows.
Acceleration Bands Trading Strategy (Backtest With Trading Rules)
After explaining the index, we can backtest it by formulating some trading rules.
Now that you understand the indicator’s purpose, let’s backtest a specific trading strategy with trading rules.
These are the trading rules:
THIS SECTION IS FOR MEMBERS ONLY. _________________ BECOME A MEBER TO GET ACCESS TO TRADING RULES IN ALL ARTICLES CLICK HERE TO SEE ALL 400 ARTICLES WITH BACKTESTS & TRADING RULES
We employ the trading rules on the Nasdaq 100 (QQQ) from its inception until today and get the following equity curve:
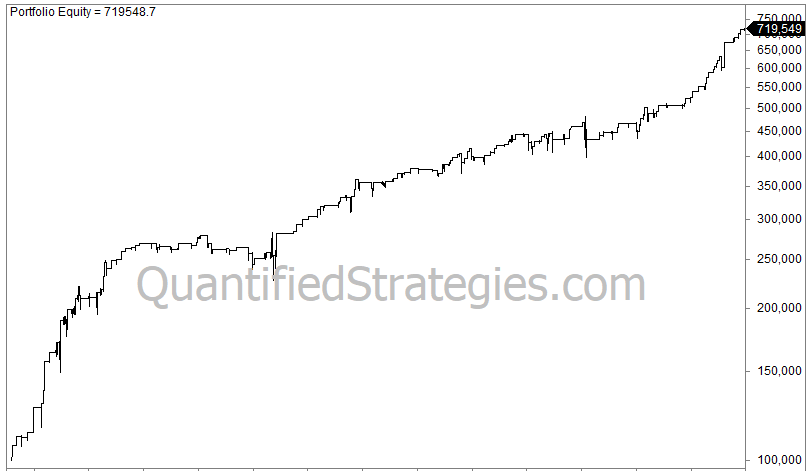
The average gain is 1.2% per trade. There are 174 trades, the annual return is 7.6%, you are invested 10% of the time, and the max drawdown was 19%.
The backtest was performed in Amibroker. Amibroker doesn’t include the Acceleration Bands, but we have coded it for you:
THIS SECTION IS FOR MEMBERS ONLY. _________________ BECOME A MEBER TO GET ACCESS TO TRADING RULES IN ALL ARTICLES
CLICK HERE TO SEE ALL 400 ARTICLES WITH BACKTESTS & TRADING RULES
How Do Acceleration Bands Work?
Acceleration Bands work as an indicator for gauging price momentum and volatility. The indicator is based on the principle of acceleration, as it aims to identify when the price is about to accelerate and when the acceleration is over.
For instance, when the price breaks above the upper band, it suggests that the security has broken out of its price range and, thus, is ready to accelerate. Breakout traders may use that as a buy signal, as it indicates an increasing bullish momentum. And when the price falls back into the band, it means that the momentum has died out, and it’s time to exit the market.
The slope of the bands generally shows the direction of the trend. If they are sloping upwards, the trend is to the upside, and if they are sloping downward, there is a downtrend. In an uptrend, the lower band can serve as a dynamic support level where deep pullbacks may reverse, while the upper band is a potential bullish breakout level for price acceleration.
Likewise, in a downtrend, the upper band can serve as a dynamic resistance level where deep pullbacks may reverse, while the lower band is a potential bearish breakout level for an accelerating downtrend.
Why Use Acceleration Bands in Trading?
You use the acceleration bands in trading because the indicator can help you gauge the level of volatility in the market, as well as spot when the price action is gaining momentum or accelerating in any direction so you can trade along. When the price breaks above the upper band, for example, it means that the momentum is to the upside, so you can look to go long, especially if you are a breakout trader.
The indicator’s width also shows the market volatility, just like the Bollinger Bands. When there is high volatility in the market, the bands move further apart, widening the width. On the other hand, during periods of low volatility, the bands move closer together, narrowing the width. When a prolonged period of low volatility is followed by a breakout of either of the bands, the price is likely going to accelerate in the direction of that breakout.
How to Set Up Acceleration Bands on Charts?
To set up acceleration bands on charts, you first check whether the indicator is one of the built-in indicators in the platform so you can simply double-click it to attach it to the chart. If it isn’t, you have to get a programmer to create a custom version of the indicator for your charting platform.
When you install it, go to the indicator section of the platform to find it. Double-click on it to attach it to the chart. A box may pop up where you input your preferred settings. The indicator is an overlay, so it plots directly on the price chart, with the upper and lower bands surrounding the price action.
What Are the Key Features of Acceleration Bands?
The key features of Acceleration Bands include:
- The middle line: This is a simple moving average (SMA). The number of periods is chosen by the trader, but the default is usually 20.
- The upper band: This is derived from the highs of the price range. The formula is given as: Upperband = high * ( 1 + 2 * (((( high – low )/(( high + low ) / 2 )) * 1000 ) * factor ))
- The lower band: This is derived from the low of the price range. The formula is given as: Lowerband = low * ( 1 – 2 * (((( high – low )/(( high + low ) / 2 )) * 1000 ) * factor ))
How to Interpret Acceleration Bands Signals?
To interpret Acceleration Bands signals, you have to understand how the indicator works and what you can do with it. The primary signal from the indicator is its slope, which generally shows the direction of the trend. Up-sloping bands signal an uptrend, while down-sloping bands signal a downtrend.
In an uptrend, a breakout above the upper band indicates a bullish momentum, which can be a buy signal for a breakout trader. For a trend-continuation swing trader, the lower band can serve as a dynamic support level where deep pullbacks may reverse, so a bullish reversal setup at this band could be a buy signal.
Likewise, in a downtrend, a breakout below the lower band indicates a bearish momentum, which can be a sell signal for a breakout trader. For a trend-continuation swing trader, the upper band can serve as a dynamic resistance level where deep pullbacks may reverse, so a bearish reversal setup at this band could be a buy signal.
What Markets Are Best for Acceleration Bands?
The best markets for the acceleration bands indicator are markets that trend in one direction but with occasional price consolidations. Although the indicator can be used in all markets, as it is based on the price data alone, it performs best in trending markets, as the trend already shows you the direction to look for trading opportunities.
For instance, in an uptrend, you can look for the breakout of the upper band or a reversal from the lower band after a pullback. A lower band breakout in an uptrend should be treated with suspicion until the market structure changes to that of a downtrend.
How to Combine Acceleration Bands with Other Indicators?
To combine Acceleration Bands with other indicators, you have to understand how the indicator works so you can select the indicators that can complement it. Being a trend and momentum, the acceleration bands are best combined with volume indicators, especially if you want to trade the breakout strategy.
Volume indicators can show whether the breakout is supported by huge trading volume, which will make the signal more significant. A breakout on low volume may be a false breakout, especially if it occurs against the trend.
What Are the Benefits of Using Acceleration Bands?
The benefits of using Acceleration Bands include:
- It can show the direction of the trend.
- It can be used to gauge the market momentum during a breakout
- It can estimate the level of volatility in the market
- It can serve as dynamic support and resistance levels depending on the direction of the trend
- It can provide breakout entry and exit signals,
- It can also be used to create pullback-reversal, trend-continuation trade setups
How to Customize Acceleration Bands Settings?
To customize Acceleration Bands settings, you have to create a trading strategy based on the indicator and backtest it. During the backtesting, you experiment with different settings to find the ones that work best for the market you are trading and the timeframe you trade on.
When you find the settings that work for you, you retain that for your strategy and the market. However, you will need to periodically evaluate the performance of the strategy to know when you need to tweak the settings.
What Are Common Mistakes with Acceleration Bands?
The common mistakes with Acceleration Bands include:
- Not creating a reliable strategy with clear entry and exit points
- Not combining the indicator with other indicators or analysis tools to improve its signals
- Using the indicator as a standalone trading strategy
- Not backtesting your trading strategy before applying it in the market
- Trading without a proper risk management plan
How Accurate Are Acceleration Bands?
The accuracy of Acceleration Bands will depend on the market condition, the strategy you use, and how you apply it. As a trend-following momentum indicator, the Acceleration Bands indicator signals are more accurate in trending markets than in non-trending markets.
Also, the way you apply the indicator matters. If you use it as a standalone trading strategy, the signals may not be very accurate compared to when it is combined with other indicators or other forms of analysis. To improve the accuracy of the signals, combine it with other indicators to create a robust trading strategy.
Can Acceleration Bands Predict Price Movements?
Acceleration Bands cannot predict price movements but it can be used to analyze price movements to identify how the price has been moving and how it might likely move in the future.
For instance, if the bands are sloping upward, it means that the market has been trending upward and may likely continue moving up. If it further breaks above the upper band, it means that the upside momentum is rising, so a buy trade is likely to be profitable assuming the price continues with that upside momentum.
How Do Acceleration Bands Compare to Bollinger Bands?
Compared to Bollinger Bands, Acceleration Bands shows the market momentum, in addition to the volatility gauge that the Bollinger Bands are known for. Both indicators are similar in that they both consist of three bands — an upper band, a lower band, and a middle line, and the middle line is a simple moving average (SMA) typically of 20 periods.
However, while the upper and lower bands of the Bollinger Bands are measured with standard deviations, the displacement of the upper and lower bands in the Acceleration Bands is derived from the range of the current period. In other words, the Bollinger Bands use the standard deviation as a measure of volatility while the Acceleration Bands use a derivative of the price range for measuring volatility.
What Trading Strategies Use Acceleration Bands?
The trading strategies that use Acceleration Bands are as follows:
- Breakout strategy: This is a strategy that aims to profit from price momentum following a breakout. With the Acceleration Bands, the aim is to trade in the direction of the breakout when the price breaks above the upper band in an uptrend or below the lower band in a downtrend.
- Trend-continuation swing trades: These are swing trades taken in the direction of the trend when the price pulls back to a support level in an uptrend or a resistance level in a downtrend. With the Acceleration Bands, the support level in an uptrend is the lower band and the resistance level in a downtrend is the upper band.
What Timeframes Work Best with Acceleration Bands?
The timeframes that work best with Acceleration Bands will depend on your trading style and the results of your backtesting. If your style is day trading, you will trade on intraday timeframes, such as the hourly, 30-minute, 15-minute, and even 5-minute timeframes.
Your backtesting results will tell you the particular timeframes that offer the best day trading performance.
Likewise in swing trading where the focus is on the daily, 8-hourly, and 4-hourly timeframes; your backtesting results will show you the best timeframe for swing trading.
How to Backtest Acceleration Bands Effectively?
To backtest Acceleration Bands effectively, follow these steps:
- Identify and study the markets you want to backtest your Acceleration Bands strategy.
- Formulate your Acceleration Bands strategy and state the parameters or settings to experiment with.
- Gather the historical data you need for the backtesting and divide the data into in-sample and out-of-sample data.
- Convert your formulated strategy into a trading algorithm.
- Run your backtesting on the in-sample data and optimize with the out-of-sample data, adjusting your parameters as needed.
- Evaluate the results of your backtesting
Are Acceleration Bands Suitable for Beginners?
Yes, Acceleration Bands can be suitable for beginners who understand how the indicator works and can formulate robust trading strategies with it. The first thing a beginner should do when trying to learn to trade with the Acceleration Bands is to study resource materials, like this one, on the indicator to learn how it works.
Next, they should formulate their strategies and open a demo account to practice their strategies in a risk-free environment.
What Software Supports Acceleration Bands?
Almost all trading software supports Acceleration Bands. From thinkorswim and TradingView to MultiCharts and TradeStation, trading software supports the use of Acceleration Bands.
The indicator may not be preinstalled in the software, but you can get a programmer to create a custom version of the indicator for whatever software you are using.
How to Improve Trading with Acceleration Bands?
To improve trading with Acceleration Bands, you can combine the indicator with other indicators or other forms of analysis, such as market structure and price action analysis.
For instance, price action analysis can show you when the market is consolidating, and if it is followed by a breakout, the odds of success are high.
What Are the Limitations of Acceleration Bands?
The limitations of Acceleration Bands include:
- It can produce a lot of false signals, especially in a sideways market.
- It needs other indicators to improve its signals
- It is more suitable for higher timeframes
How to Use Acceleration Bands for Trend Following?
To use Acceleration Bands for trend following, the slope of the indicator is a key signal. If the bands are sloping upward, the trend is to the upside. In that case, you can look to trade the breakout of the upper band or a bullish reversal setup after a pullback to the lower band.
Likewise, if the bands are sloping downward, the trend is to the downside. In that case, you can look to trade the breakout of the lower band or a bearish reversal setup after a pullback to the upper band.
What Expert Tips Enhance Acceleration Bands Usage?
Here are some expert tips to enhance your usage of Acceleration Bands:
- Trade breakouts only in the direction of the trend
- Use the slope of the middle line to know the direction of the trend
- A false breakout of the lower band in an uptrend is a high-probability buy setup
- A false breakout of the upper band in a downtrend is a good sell setup
How Do Acceleration Bands Respond to Volatility?
Acceleration Bands respond to volatility by moving further away from each other when the volatility is high and closer to each other when the volatility is low.
That is, during periods of high volatility, the width widens, and during periods of low volatility, the width narrows.
Where to Learn More About Acceleration Bands?
Apart from the material you are reading now, other places you can learn more about Acceleration Bands include Quantifiedstrategies.com, therobusttrader.com, and all the books written by Price Headley, especially “Big Trends in Trading” and “High Impact Options Trading”.