
Internal Bar Strength (IBS) Indicator Strategies, Trading Rules And Backtests
The Internal Bar Strength indicator (IBS) is a technical analysis methodology used to gauge market momentum and identify short-term price reversals based on the position of a financial instrument’s closing price within the bar’s range for the previous day. The IBS indicator is particularly useful for short-term mean-reverting strategies and helps guide trading decisions by identifying potential reversals. The IBS strategy operates under the premise that markets tend to revert to their average price after extreme movements. It has worked remarkably well for over two decades. We can only guess why, but the stock market has been highly mean-reverting during this period, and this has, of course, given the IBS a nice tailwind.
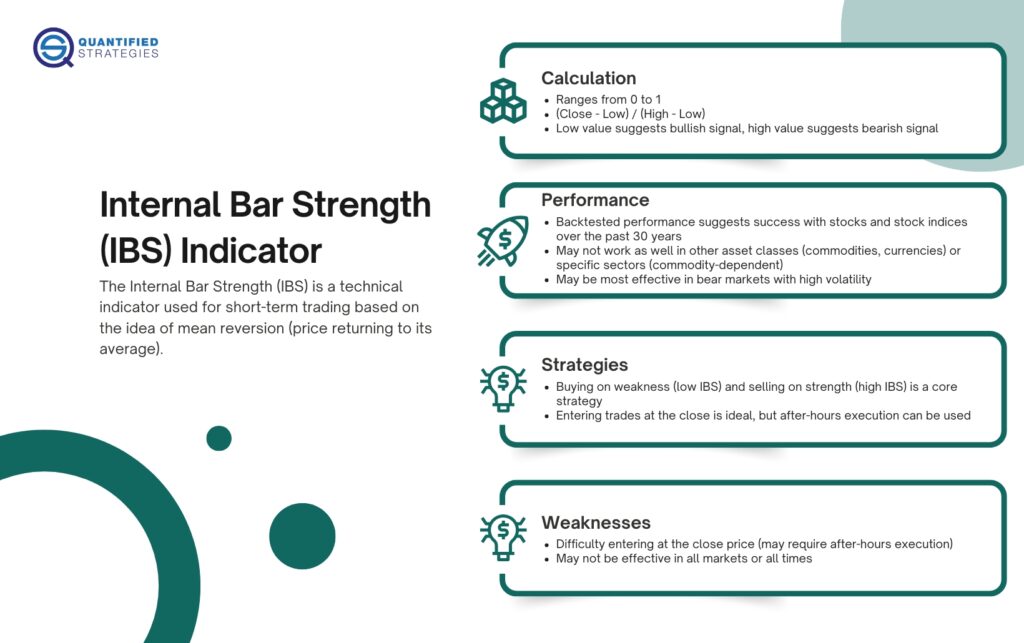
IBS is simply an indicator where you buy on weakness and sell on strength, the cornerstone of any mean-reverting strategy. It oscillates from zero to one and measures the relative position of the closing price relative to the High and Low of the previous day, which is referred to as the bar’s range. The IBS is calculated using the following formula: (Close – Low) / (High – Low), where all values are taken from the previous day. An IBS value near 1 suggests overbought conditions, while a value near 0 suggests oversold conditions. A low IBS value (e.g., below 0.2) can signal a buy opportunity (bullish signal), while a high IBS value (e.g., above 0.8) can signal a sell opportunity. The assumption is that the market is mean-reverting. We make some examples of internal bar strength strategies.
Key takeaways
- The Internal Bar Strength (IBS) indicator is a technical analysis tool that measures the relative position of a day’s closing price within its high-low range.
- Calculated as (Close – Low) / (High – Low), IBS values range from 0 to 1, where values near 0 indicate the close is near the day’s low, and values near 1 indicate it’s near the high.
- This indicator is particularly useful in mean-reverting strategies, suggesting potential buy signals at low IBS values and sell signals at high IBS values.
- Empirical backtesting has shown that IBS-based strategies have performed well over the past three decades, especially in stock markets and broad-based indices like the S&P 500 (SPY) and Nasdaq (QQQ).
- For instance, a simple strategy yielded an average gain per trade of 0.8% with a 78% win ratio in SPY, and a 1.33% average gain per trade with a 75% win ratio in QQQ.
- Notably, IBS-based strategies tend to perform best during volatile or bear market conditions, as these periods often exhibit stronger mean-reverting behavior.
- However, the effectiveness of IBS diminishes in markets heavily influenced by commodities, such as Norwegian and Australian stocks, as well as in commodity-specific sectors like gold and metals.
- Additionally, the strategy requires precise execution, often necessitating trades near the market close to capture the intended signals.
- Backtesting the IBS strategy on historical data for 5–10 years is recommended to confirm its effectiveness in a specific market before live deployment.
- Transaction costs can significantly impact the profitability of IBS-based strategies, especially for small average trades, so they must be carefully considered.
- Monitoring maximum drawdown is crucial as a key risk metric when evaluating IBS strategies to understand potential worst-case losses.
- Implementing risk management techniques, such as setting stop-loss orders (e.g., a 10% stop loss), is essential to protect capital from abnormal price swings and significant market downturns.
- We have covered all stock technical inditiveness.)ctiveness.)atorstiveness.).
A short summary of the Internal Bar Strength (IBS) indicator
Internal Bar Strength Indicator
This article explains the Internal Bar Strength Indicator and internal bar strength strategy. We test it empirically (backtest) and explain which markets you will most likely succeed in.
The conclusion is that the Internal Bar Strength Indicator has worked remarkably well over the last 30 years on stocks and stock indices, less so on other asset classes. Last, we backtest some trading strategies based on the IBS indicator.
Is this likely to continue? The indicator made a spectacular comeback in 2019 and 2020 after 2018 produced the first negative return in this century. The increased volatility following the unprecedented Covid-19 lockdowns has made 2020 the best year on record.
If you find this article useful, you might want to have a look at our landing pages for a lot of other trading strategies and edges:
The formula for IBS is as follows:
(Close-Low)/(High-Low)
Let’s illustrate with an example from the 28th of October 2020: SPY, the ETF of the S&P 500, had a high of 338.25, a low of 326.13, and closed at 326.66. These high, low, and close values are from the previous trading day. Thus, the IBS that day would be calculated like this:
(326.66 – 326.13)/(338.25 – 326.13) = 0.043
This was a bad day for stocks, where SPY opened significantly down and continued falling throughout the day. The low value of the IBS indicates a good setup for a mean reversion trade. As it turned out, the next day, the 29th of October, ended as a positive day.
The internal bar strength strategy is designed for short-term trades, typically holding positions for 1–4 days, and is applied on a daily timeframe to capture short-term price movement. Understanding price movement and daily price fluctuations is essential for optimizing the IBS strategy and managing risk.
Internal Bar Strength (IBS) video
We present three different IBS strategies in this video.
Internal Bar Strength quantified (trading strategies)
Many financial commentators have written about the coming demise and reduced strength of the IBS, recently as late as 2018, after many months of weak performance. As with most things in the financial markets, all good things must come to an end, and IBS performed poorly in 2017 and 2018.
IBS is a very simplistic indicator and widely used by algos, perhaps indicating the good times are over. The markets are flooded with capital, brains, and computing power, and the most popular indicators and strategies will be “arbed” away when they get widely used.
On this blog we have several times used IBS together with other indicators. However, I have never looked at IBS solely on its own, and this article has a short look at how IBS has performed on the S&P 500 and Nasdaq. Let’s backtest an IBS strategy:
Let’s first start with the S&P 500 by using the ETF SPY. The criteria are simple (using Amibroker). We make the following trading rules:
After introducing the trading rules, it’s important to note that a trend filter can be applied to the internal bar strength strategy to only take a long position when the overall market is in an uptrend. For example, combining a trend filter such as an Exponential Moving Average (EMA) with IBS can help filter out false signals and improve the robustness of the strategy.
Traders can enter a long position when the IBS value is below 0.2, indicating oversold conditions, and exit the long position when the IBS value rises above 0.8, indicating overbought conditions. Additionally, a volume filter can be used so that trades are only taken when a low IBS occurs on high-volume days, which may signal a likely reversal after a panic sell-off.
THIS SECTION IS FOR MEMBERS ONLY. _________________ BECOME A MEBER TO GET ACCESS TO TRADING RULES IN ALL ARTICLES CLICK HERE TO SEE ALL 400 ARTICLES WITH BACKTESTS & TRADING RULES
An incredible simple IBS strategy and IBS trade!
Despite its simplicity, it has yielded excellent results from SPY’s inception in 1993 until today (assuming 100 000 invested in 2000 and 100% exposure of equity since then – i.e. compounded results):
| #Trades | 919 |
| Average gain per trade | 0.41% |
| Win-ratio | 68% |
| CAGR – annual returns | 12.5% (buy and hold 9.9%) |
| Average gain winners | 1.3% |
| Average loss losers | -1.5% |
| Profit factor | 1.9 |
| Max % drawdown | -26% |
The equity curve looks like this (compounded):
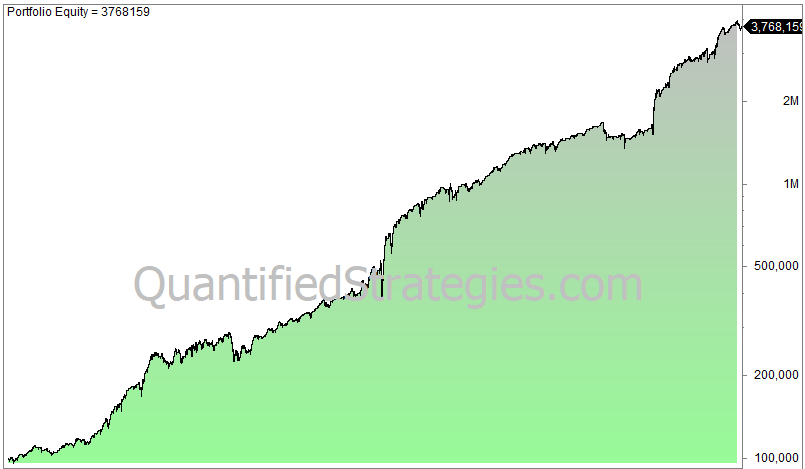
IBS indicator trading strategy
Even though slippage and commissions are not included (which are very low, by the way, for such a liquid instrument), there have been only three years of losses so far: 1994, 2002, and 2018.
The IBS has worked even better on Nasdaq (QQQ – compounded since inception until today):
Internal Bar Strength Indicator
The 742 trades returned 0.56% per trade and compounded at 16.6% – significantly better than buy and hold’s 9%.
Let’s make a twist to the Internal Bar Strength Indicator (IBS) strategy
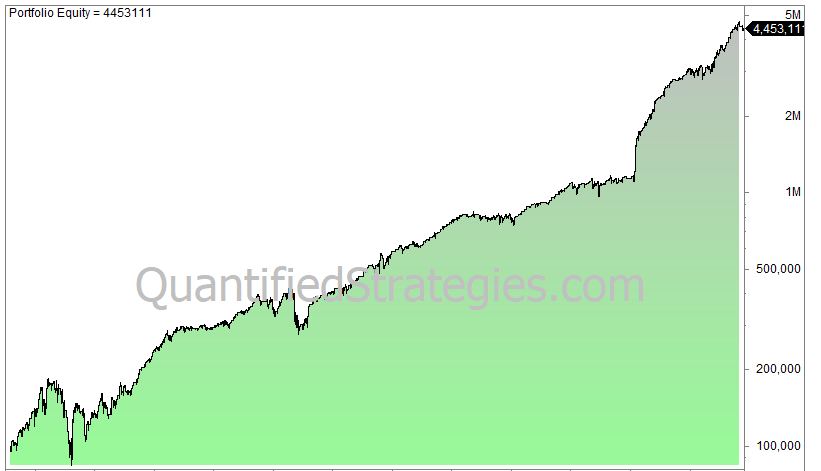
Let’s change the IBS strategy somewhat but still use the IBS as the only indicator for both the entry and the exit, and we get the following equity curve from 1993 until today for SPY:
Internal Bar Strength Indicator backtest
The strategy produced a CAGR of 15.3% while being invested only 36% of the time. There are 583 trades, the average trade lasts 5.8 trading days, the win rate is 74%, the average win is 1.67%, the average loser is 1.75%, the max drawdown is 22%, the profit factor is 2.73, and the Sharpe Ratio is 1.7.
For exit rules, traders can close a long position when the IBS rises above a high IBS value, such as 0.8, which often signals overbought conditions and a potential reversal. This approach uses the high ibs value as an overbought/oversold indicator and is common in mean reversion strategies.
It’s important to note that the internal bar strength strategy may behave differently in trending markets, as IBS signals can be less reliable when strong trends are present. Combining IBS with other indicators, such as the Exponential Moving Average (EMA), can help filter signals and improve overall performance.
Would you like to know the code and the criteria? You get the code for Amibroker/Tradestation and in plain English. You can order the strategy by clicking the links below or become a member. You can order the strategy on this link (IBS Strategy no. 2):
When you have paid, please press the link below to access the code (PDF file):
Download the IBS strategy no.2 by clicking here (you need to pay for access)
OR
You can become a member. We present similar ideas monthly – please subscribe to our Trading Edges
The Internal Bar Strength indicator works best in bear markets
Perhaps ironically, the strategy seems to perform the best in bear markets. The reason is most likely that the biggest up days happen in bear markets.
Yes, you heard it right: the biggest up days happen during bear markets, perhaps contrary to common sense. You can read more in our blog post about the anatomy of a bear market.
For example, from the top in May 2008 to the bottom in early March 2009 (the GFC), S&P 500 lost about 50% of its value, but there were 99 up days and 104 down days during this period. During the same period, it was 51 days with daily rises (from close to close) higher than 1% and 30 days with daily rises above 2%.
We suspect that short covering is one of the main reasons we see these enormous spikes during bear markets. Bear markets are shorter in duration than bull markets, and increased uncertainty makes the markets much more volatile. Bull markets are sedate: the daily volatility is significantly lower.
Does adding a filter only to take signals during volatile times pay off?
We can, for example, add a volatility filter like VIX: buy only when VIX closes above a moving average of x days. If we use a VIX filter where we require VIX to close above its 100-day average, the average gain per trade in SPY increases from 0.41% to 0.53% while the profit factor goes from 1.92 to 2.19 (for SPY).
However, be careful adding this filter because an optimization reveals the result is pretty variable from even small changes in the number of days of the moving average.
By tweaking a little, it seems the IBS works best as long it’s not too overbought compared to the 200-day moving average. If the close of SPY is max 5% above the 200-day moving average, it improves the result the best:
The average gain is 0.53% and the profit factor is 2.23. However, be careful as the risk of curve fitting is high. However, it shows that you can employ the IBS indicator systematically and successfully.
Combining the Internal Bar Strength indicator with other indicators
The numbers below show how you improve the results by combining two indicators in a twist to the trading strategies we did above. This table illustrates the results for SPY since its inception:
| #Trades | 278 |
| Average gain per trade | 0.8% |
| Win-ratio | 78% |
| #days per trade | 4.8 |
| Average gain winners | 1.7% |
| Average loss losers | -2.3% |
| Profit factor | 2. |
| Max % drawdown | -23.75% |
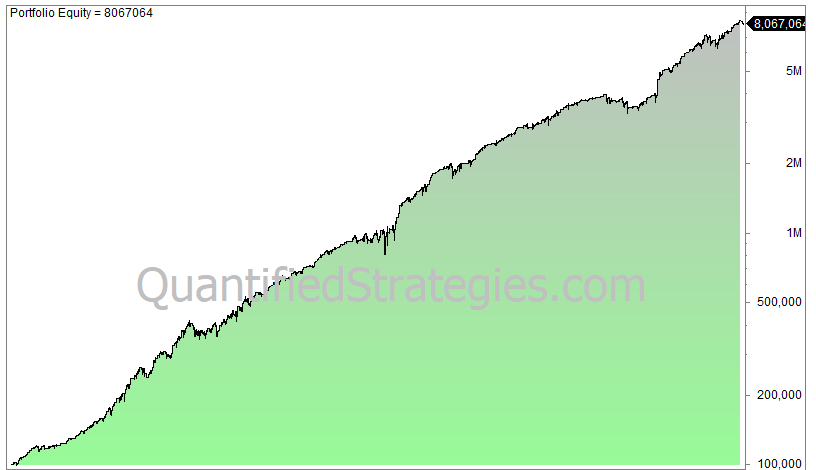
For QQQ (since inception) the results are much better:
| #Trades | 232 |
| Average gain per trade | 1.33% |
| Win-ratio | 75% |
| #days per trade | 4.8 |
| Average gain winners | 2.4% |
| Average loss losers | -2.1% |
| Profit factor | 2.9 |
| Max % drawdown | -19.5% |
The equity curve compounded for QQQ looks impressive (logarithmic chart):
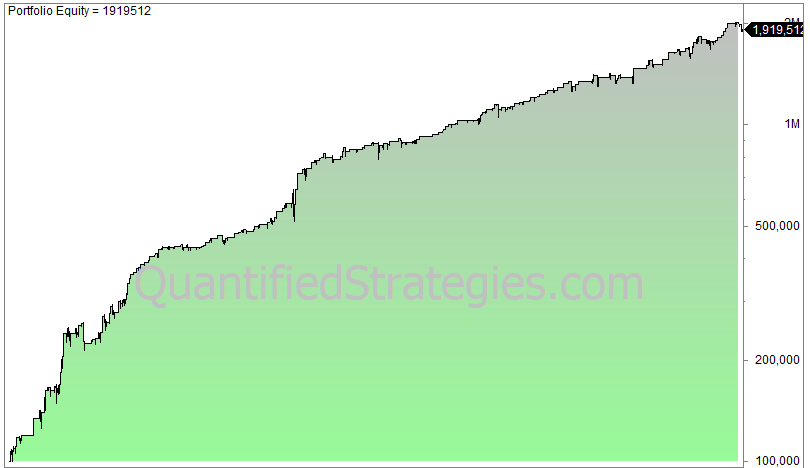
Internal bar strength indicator strategy
The overlap in trades between SPY and QQQ is, of course, very high, and thus, it doesn’t make sense to trade both, in our opinion.
Would you like to know the code and the criteria? You can order the strategy by clicking here or by becoming a member.
You can order the strategy on this link (please choose “IBS + second indicator” product – you get the code in Amibroker/Tradestation and plain English):
When you have paid, please press the link below to access the code (PDF file):
Download the IBS + second indicator strategy by clicking here (you need to pay for access)
OR
Alternatively, you can become a member and we send out ideas like this monthly for a much lower fee per edge.
Does the Internal Bar Strength indicator work in any market?
Unfortunately, it doesn’t. The IBS more or less only works on single stocks and stock indices. Furthermore, it works best on indices that have a broad selection of different industries. It is a mean reversion strategy.
Some parts of the stock population produce poor returns using the IBS: commodity stocks for example.
Hence, IBS doesn’t work well on Norwegian and Australian stocks/indices, as both countries depend heavily on commodity prices. Likewise, you will be hugely disappointed if you try IBS on gold and metal stocks. It simply doesn’t work.
Does this mean we should skip the indicator, assuming a robust indicator should work on all asset classes?
No. It’s naive to believe that any indicator works on all asset classes. Every market has its own “rules” and ecology where you, as a trader, must adapt to the current and local environment.
Just as a Norwegian investor can’t expect to find the same temperament and mentality in Nigeria as in Norway, you, as a trader, must adapt to the market you are trading in. There are no universal rules across the asset classes. This is not curve fitting.
While that may disappoint many, it can also provide opportunities if you are willing to adapt and do proper research.
Trading with Equity Curve
The equity curve is a vital tool for evaluating any trading strategy, and this is especially true when using the Internal Bar Strength (IBS) indicator. An equity curve visually represents the cumulative profit and loss of a strategy over time, allowing traders to assess the consistency, risk, and overall effectiveness of their approach.
When applying the IBS indicator—also known as the internal bar strength indicator—traders are essentially measuring the relative position of the closing price within the day’s high-low range. This technical analysis tool is designed to identify potential reversals and mean reversion opportunities, particularly when the IBS value is at an extreme (either low or high). By tracking the equity curve of an IBS-based strategy, traders can see how well the strategy performs across different market conditions and periods of volatility.
A mean reversion strategy built around the IBS indicator typically involves buying when the IBS value is low (indicating the closing price is near the day’s low and the asset may be oversold) and selling when the IBS value is high (suggesting the closing price is near the day’s high and the asset may be overbought). Over time, a successful mean reversion strategy should produce an equity curve that trends upward, reflecting a series of profitable trades. However, it’s normal to see drawdowns, especially during periods of heightened volatility or when the market is trending strongly in one direction.
To maximize the effectiveness of an IBS-based trading strategy, it’s crucial to establish clear trading rules. These rules should define entry and exit points based on the internal bar strength IBS value, as well as incorporate risk management techniques such as position sizing and stop-loss levels. Metrics like average trade profit, win rate, and average true range (ATR) are essential for evaluating the quality of trades and the robustness of the strategy. For example, analyzing the average trade and the equity curve together can help traders identify periods where the strategy underperforms and make necessary adjustments.
In bear market conditions, the IBS indicator can be particularly powerful for identifying potential reversals, as markets often experience sharp rebounds from oversold levels. By combining the IBS indicator with other technical analysis tools—such as moving averages or volatility filters—traders can further enhance their strategy’s performance and reduce the risk of false signals.
The weakness of the Internal Bar Strength indicator is execution:
One weakness of the strategy is the need to enter on the close. Obviously, you don’t know the close until after the fact, meaning you need to enter just seconds before or after the close in the after hours. This is a hassle unless you trade automatic systems via your computer or VPS. We solve this by entering just a few seconds before the close.
The importance of getting the closing price is paramount. If you delay the execution to the open the day after the signal, the return falls significantly: for S&P 500 the average gain per trade falls from 0.41% to 0.31%. All essential parameters worsen, also for QQQ.
Concluding remarks about the IBS:
The IBS indicator still seems to work pretty well. However, it performs best under conditions where uncertainty makes the stock markets volatile. Furthermore, it’s one of the most straightforward formulas to compute.
We use IBS in our own swing trading, but always together with some other indicator or factors.
Furthermore, don’t expect the indicator to work in any market: it only works on stocks in specific industries and stock indices with a broad base of different sectors/industries.
We believe you can develop a profitable IBS strategy if you use some of the hints in this article.
Can the strategy be improved?
We are not oracles, and we are sure some traders can improve the strategy. Do you have any ideas on how to improve it?
If so, drop us an e-mail.