Monthly Seasonalities in Long-Term Treasuries (TLT) – Unveiling Potential Trends
Are there any monthly seasonalities in TLT?
Yes, just like in stocks there are some strong and weak months. August is, by far, the best month.
We are now entering the best month over the last 20 years in long-term treasuries (TLT) – August. From the last closing price of July until the last in August the average has been a pretty solid 3.23%. This is substantially more than any other month. Four months/years have shown losses, all pretty moderate.
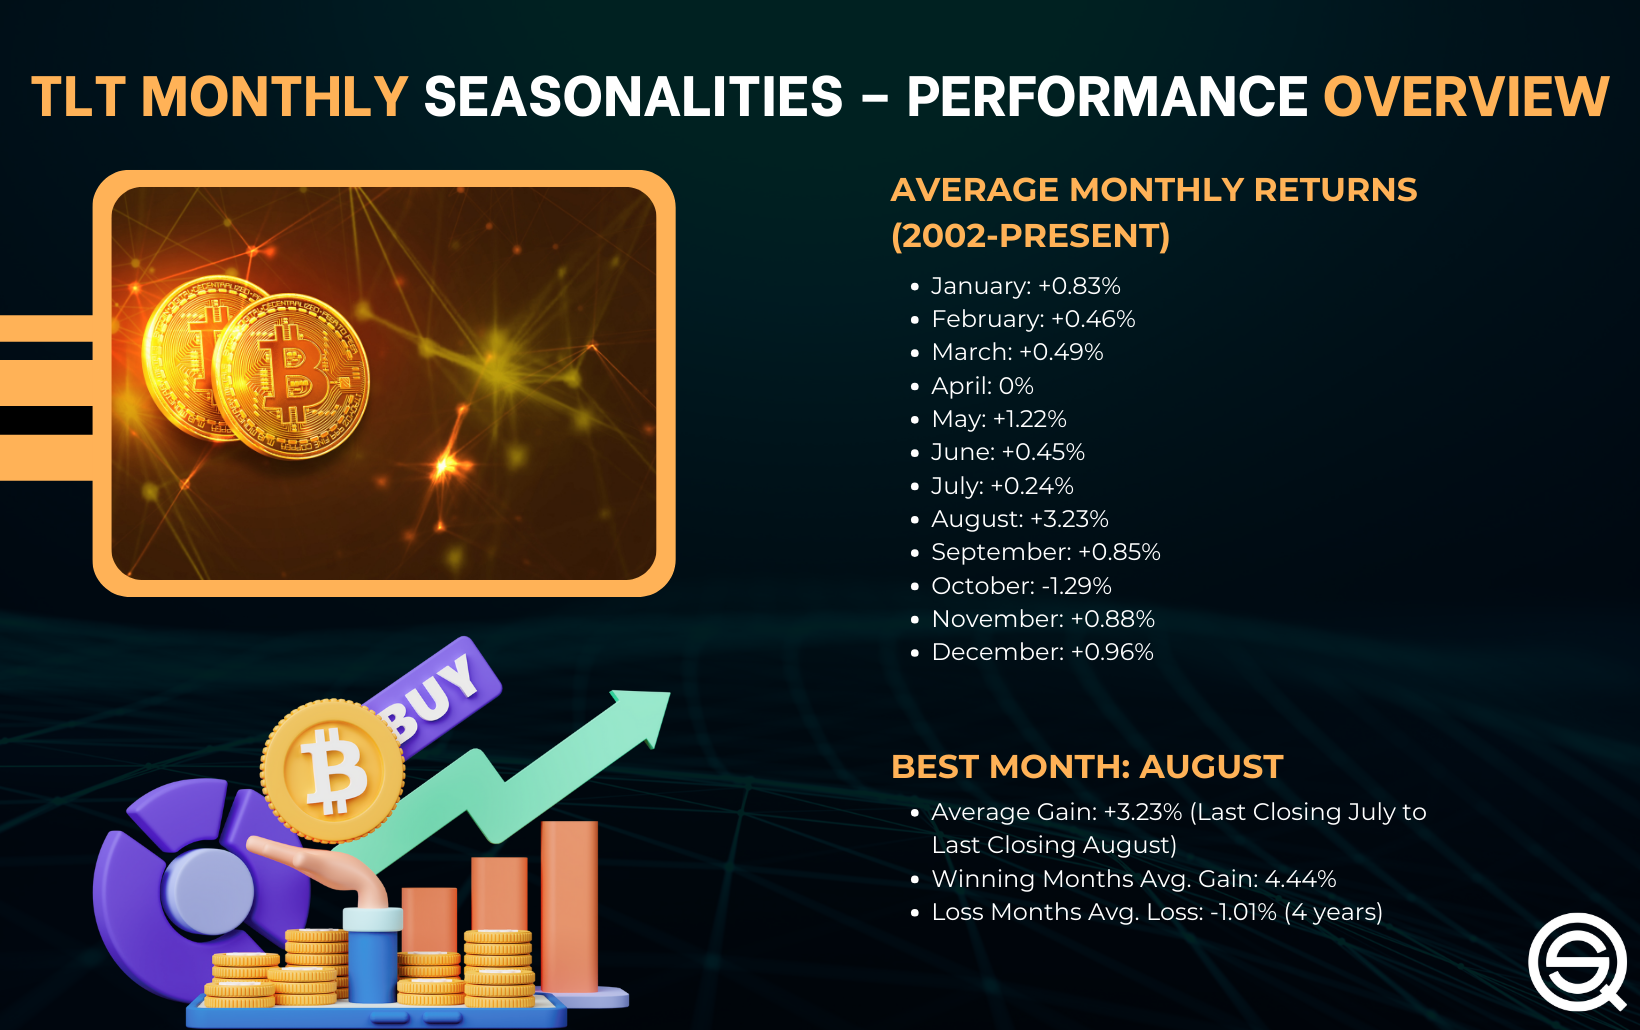
The average gain for winning months is 4.44%, while the average gain for the four years where August showed a loss was -1.01%. TLT, the ETF for long-term treasuries, has had this equity curve since 2002 until today, assuming 100 000 in starting capital and being 100% invested in August every year:

For all months it looks like this:
| Per trade % | ||
| January | 0.83 | |
| February | 0.46 | |
| March | 0.49 | |
| April | 0 | |
| May | 1.22 | |
| June | 0.45 | |
| July | 0.24 | |
| August | 3.23 | |
| September | 0.85 | |
| October | -1.29 | |
| November | 0.88 | |
| December | 0.96 |
Is this table of any use? For me, it’s not, but it might generate some ideas for other users.

—————————————-
If you would like to have the Amibroker and Tradestation code for this strategy plus 70+ other free trading strategies published on this website, please click on this link:

For more trading strategies, please click here:
- Free trading strategies
- Monthly trading edges (subscription service)
FAQ:
– What is the average return for TLT in August over the last 20 years?
The average return for TLT in August, from the last closing price of July until the last in August, has been a solid 3.23%, making it substantially more favorable compared to other months.
– How does the equity curve for TLT look from 2002 until today, specifically in August?
The equity curve for TLT from 2002 until today, assuming a starting capital of 100,000 and being 100% invested in August every year, has shown impressive results. The author provides a visual representation of the equity curve.
– What are the average gains for winning months and the average losses for the four years where August showed a loss in TLT?
The average gain for winning months in TLT is 4.44%, while the average loss for the four years where August showed a loss was -1.01%. This suggests a consistent positive performance in August over the years.