
Trading Strategies for Sale (Ranked And Sorted)
Below, you will find backtested and researched trading ideas and analysis for our Trading Strategies for Sale. This little shop contains performance metrics, statistics, risks, historical performance, and figures.
The historical performance and figures for strategies found in our shop may not indicate future success (they are hypothetical). One of the limitations of hypothetical performance results is that they are prepared with the benefit of hindsight and may not reflect the future. The strategy is only backtested on the indicated asset; a backtest has limitations, and strategies might fail after backtesting (despite all strategies having at least one year of incubation before release). If you are unsure, please read our full disclaimer. Simulations are done at the close unless otherwise stated (how to trade at the close – or alternative entries).
Ranking our Strategies
For a summary of the strategies, please see the table below. Each strategy from our shop is listed in detail under the table.
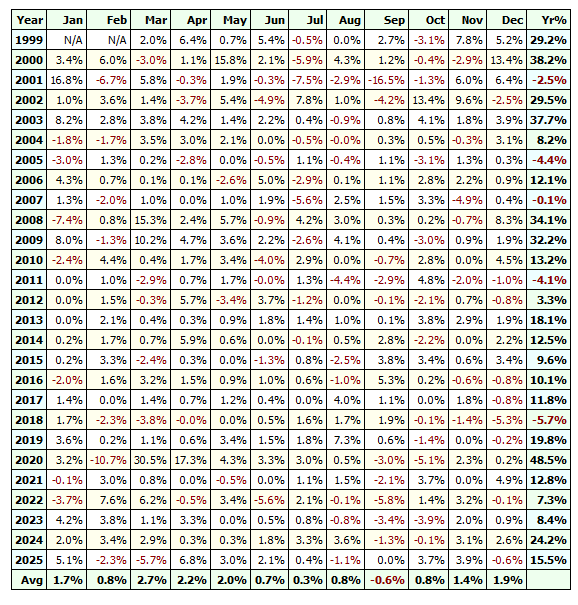
| Trading Strategy # | Asset | Strategy Name/Type | No. of Trades | Avg. Gain per Trade | Win Ratio | Profit Factor | CAGR | Exposure/Time in Market | Risk-Adjusted Return | Max Drawdown |
| 1 | QQQ | Swing Trade Nasdaq (volatility bands) | 189 | 1.6% | 80% | 3.1 | 12.1% | 11% | 110% | -19.5% |
| 2 | SPY | IBS Swing Trade in the S&P 500 | 596 | 0.77% | 73% | 2.2 | 14.5% | 36% | 40% | -22% |
| 3 | QQQ | Williams R% Swing Trade in Nasdaq | 255 | 1.1% | 75% | 2.8 | 11.4% | 14% | 81% | -20% |
| 4 | QQQ | Two Indicator Swing Trade Strategy | 232 | 1.2% | 73% | 2.7 | 10.7% | 14% | 76% | -19% |
| 5 | QQQ | Double Indicator Swing Trade in Nasdaq | 285 | 1.0% | 75% | 2.5 | 11% | 17% | 66% | -25% |
| 7 | XLP | XLP swing trade | 477 | 0.35% | 72% | 1.8 | 8.1% | 32% | 20% | -15% |
| 8 | XLP | XLP Swing Trade (two variables) | 163 | 0.5% | 80% | 2.2 | 3.6% | 10% | N/A | -10% |
| 9 | QQQ | Overnight Edge in Nasdaq | 474 | 0.15% | 60% | 1.5 | 2.9% | 7.3% | N/A | -10% |
| 10 | QQQ | End Of Month Overnight Edge In Nasdaq | 192 | 0.18% | 61% | 1.9 | 1.1% | 3% | N/A | -3% |
| 11 | TLT | Seasonal Bond Trade | 288 | 0.3% | 70% | 1.8 | 3.7% | 16% | N/A | -9% |
| 12 | GLD | Breakout Strategy (Long) In Gold | 509 | 0.32% | 76% | 1.8 | 8% | 28% | 28% | -13% |
| 13 | QQQ | QQQ Collapse Trading Strategy (Long) | 400 | 0.56% | 62% | 1.7 | 8.8% | 10% | 80% | -23% |
| 14 | QQQ | Long Momentum Strategy for Nasdaq | 131 | 1.05% | 82% | 3 | 5.3% | 15% | 34% | -26% |
| 15 | TLT | Short swing trade in TLT (bonds) | 211 | 0.47% | 12% | 1.8 | 4.3% | 26% | 16% | -13% |
| 16 | XLU | Long swing trade in XLU (utilities) | 158 | 0.72% | 62% | 1.9 | 4.3% | 14% | 30% | -17% |
| 17 | SPY | Long volatility swing trade in SPY | 394 | 0.34% | 77% | 2.1 | 4.1% | 10% | 39% | -18% |
| 18 | SPY | Overnight long trade in SPY | 374 | 0.28% | 60% | 1.6 | 3.1% | 5% | 68% | -16% |
| 19 | SMH | Short Swing Strategy Semiconductors | 109 | 0.79% | 75% | 2.4 | 3.5% | 3% | 110% | -12% |
| 20 | SPY | Overnight long trade in SPY (Seasonal) | 318 | 0.37% | 62% | 2 | 3.5% | 4% | 90% | -8% |
| 21 | QQQ | Long swing trade in QQQ | 189 | 0.75% | 72% | 2.1 | 6.0% | 12% | 49% | -19% |
| 22 | QQQ | Long overnight trade in QQQ/SPY | 431 | 0.55% | 61% | 1.9 | 9% | 6% | 135% | -12% |
| 23 | XLP | Short swing trade XLP | 210 | 0.3% | 69% | 2.1 | 2.1% | 6% | 36% | -6% |
| 24 | XLV | Long swing trade XLV/XLU (Seasonal) | 160 | 0.55% | 62% | 2 | 3.3% | 9% | 34% | -7% |
| 25 | TLT | Long and short swing trade TLT (Seasonal) | 416 | 0.42% | 62% | 1.7 | 9.3% | 37% | 25% | -18% |
| 26 | QQQ | Long QQQ volatility strategy | 324 | 0.95% | 75% | 2.3 | 12.6% | 20% | 62% | -23% |
| 27 | SPY | Long holiday swing trade S&P 500 | 123 | 0.3% | 60% | 2 | 1.2% | 2% | 60% | -7% |
| 28 | FGBL | Long seasonal swing trade German bunds | 179 | 0.36% | 71% | 2.5 | 2.8% | 15% | N/A | -5% |
| 29 | VNQ | Long swing trade real estate stocks | 375 | 0.82% | 61% | 2.1 | 14.5% | 51% | 28% | -33% |
| 30 | TLT | Long swing trade Treasury bonds | 242 | 0.31% | 69% | 2 | 3.3% | 13% | 24% | -9% |
| 31 | QQQ | Trading volume strategy | 225 | 1.4% | 79% | 3.5 | 12.4% | 10% | 127% | -19% |
| 32 | GLD | Long swing trade GLD (gold) | 179 | 0.5% | 71% | 2.1 | 4.4% | 10% | 42% | -14% |
| 38 | SPY | RSI Trading Strategy | 402 | 0.6% | 73% | 2.3 | 7.9% | 13% | 57% | -16% |
| 39 | SPY | Stochastic Indicator Trading Strategy | 397 | 0.5% | 72% | 2.2 | 6.2% | 13% | 47% | -20% |
| 40 | QQQ | MACD (Histogram) Trading Strategy | 121 | 1.3% | 80% | 4.5 | 6.1% | 6% | 103% | -20% |
| 41 | SPY | Bollinger Band Trading Strategy | 568 | 0.4% | 70% | 1.7 | 6.5% | 20% | 16% | -18% |
| 42 | SPY | Bundle: 3 Trend following Strategies | 22 | 31.9% | 77% | 6 | 7.6% | 81% | 9.4% | -35% |
| 43 | QQQ | Bundle: 3 Swing Trading Strategies | 492 | 0.75% | 71% | 2.3 | 14.3% | 29% | 49% | -31% |
| 44 | QQQ | MACD Indicator Trading Strategy | 181 | 1% | 77% | 3 | 7.2% | 9% | 81% | -11% |
| 45 | SPY | Heikin Ashi Trading Strategy (Long-term) | 84 | 4.6% | 50% | 3 | 5.1% | 66% | 7.5% | -29% |
| 46 | SMH | LL & LH Trading Strategy (Mean Reversion) | 236 | 1% | 74% | 2.4 | 9.8% | 13% | 73% | -48% |
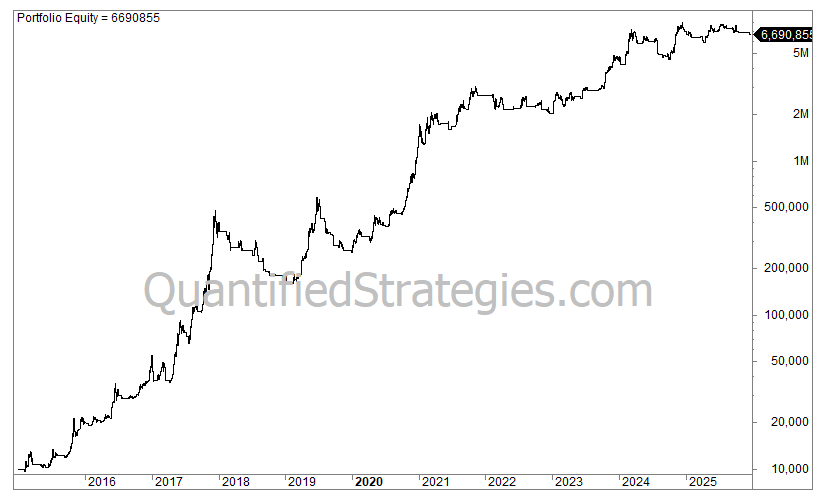
| 47 | Combined | Bundle: Combining long and short strategies | 607 | 0.58% | 70% | 1.9 | 19% | 27% | 59% | -17% |
| 48 | BTC-USD | Bundle: Bitcoin Trading Strategy (3 Strategies) | 163 | 5.7% | 47% | 2 | 100% | 60% | 168% | -49% |
| 49 | SPY | Buy the dip Trading Strategy (Mean Reversion) | 284 | 0.4% | 71% | 2.4 | 3.4% | 9% | 34% | -14% |
| 50 | SPY | Super indicator Trading Strategy (Weekly) | 39 | 10.8% | 66% | 4 | 5.9% | 62% | 9.5% | -24% |
| 51 | SPY | Money Flow Index Trading Strategy | 895 | 0.3% | 72% | 1.7 | 7.5% | 28% | 26% | -23% |
| 52 | S&P 500 | Momentum Trading Strategy | 43 | 10.1% | 67% | 7 | 5.9% | 65% | 9% | -25% |
| 53 | SPY | Short-Term Pullback Strategy | 379 | 0.47% | 69% | 2.52 | 5.5% | 14% | 39% | -14% |
| 55 | QQQ | IBS Trading Strategy | 525 | 0.65% | 68% | 2.2 | 13.3% | 26% | 50% | -41% |
| 56 | GLD | Gold Seasonal Trend Strategy | 87 | 0.72% | 72% | 3 | 3.1% | 4.1% | 76% | -6% |
| 57 | SPY | Coppock Trading Strategy | 13 | 44% | 100% | NA | 6.4% | 73% | 8.6% | -30% |
| 58 | SPY | 200-Day Moving Average Trading Strategy | 81 | 6.4% | 50% | 2.9 | 6.9% | 70% | 9.9% | -22% |
| 59 | SPY | Triple RSI Trading Strategy | 97 | 1.2% | 90% | 8 | 3.8% | 5% | 69% | -13% |
| 60 | QQQ | Nasdaq Interest Rate Strategy | 264 | 0.76% | 73% | 2.5 | 8.8% | 16% | 55% | -19% |
| 61 | QQQ | Rubber band Trading Strategy | 277 | 1.05% | 70% | 2.2 | 11.2% | 16% | 68% | -23% |
| 62 | GLD | Gold Weekly Momentum Strategy | 144 | 1% | 80% | 2.3 | 6.9% | 35% | 20% | -24% |
| 63 | S&P 500 | Chopiness Strategy | 319 | 0.6% | 74% | 2.3 | 5.5% | 10% | 55% | -19% |
| 64 | SPY, GLD, TLT | Monthly momentum strategy (Rotation) | 476 | 0.8% | 56% | 1.4 | 8.6% | 90% | 9.5 | -19% |
| 65 | SPY | Last Trading Day Of The Month Strategy | 197 | 0.54% | 78% | 2.5 | 3.4% | 6% | 59% | -13% |
| 66 | ^RUT (IWM) | Russell 2000 rebalancing strategy (Seasonal) | 25 | 1.4% | 68% | 3 | 1.4% | 2% | 69% | -6% |
| 67 | QQQ | ADX Trading Strategy | 340 | 0.85% | 78% | 2.2 | 11.3% | 17% | 65% | -21% |
| 69 | Monthly (Rotation) | Monthly (Or Weekly) Sector Rotation (monthly metrics) | 187 | 1.4% | 60% | 2 | 12.5% | 100% | N/A | -21% |
| 70 | SMH | Bollinger Bands + RSI Trading Strategy (Long/Short) | 297 | 0.65% | 67% | 1.9% | 8.3% | 16% | 51% | -13% |
| 71 | SMH | MACD + RSI Trading Strategy | 235 | 0.9% | 73% | 2.3 | 8% | 14% | 56% | -46% |
| 72 | QQQ | ADX + RSI Trading Strategy | 258 | 1% | 73% | 2.4% | 10.5% | 15% | 70% | -23% |
| 73 | SPY | Day Trading Strategy (Short) For S&P 500 | 109 | 0.28% | 69% | 2.5 | 1.3% | 2% | 671% | -3% |
| 74 | TLT | Long Panic Strategy For Bonds | 85 | 0.35% | 76% | 3 | 1.3% | 2.5% | 52% | -2.7% |
| 75 | QQQ | Bundle: 3 VIX Trading Strategies | 506 | 0.7% | 73% | 1.8 | 13.4% | 30% | 45% | -23% |
| 76 | SPY | DMI Trading Strategies | 400 | 0.35% | 74% | 2 | 5.7% | 12% | 34% | -17% |
| 77 | SPY | Bear Market Day Trading Strategy (Long) | 100 | 0.5% | 62% | 2 | 1.5% | 1% | 126% | -5% |
| 78 | SPY | Day Trading Strategy S&P 500 | 166 | 0.45% | 60% | 1.9 | 2.3% | 2% | 110% | -9% |
| 79 | IWM | Short Strategy For Russell 2000 | 167 | 0.6% | 65% | 2.3 | 3.9% | 4% | 86% | -11% |
| 80 | SPY | End-of-Month Strategy S&P 500 | 641 | 0.35% | 72% | 2 | 6.4% | 21% | 30% | -16% |
| 81 | SPY | Turnaround Tuesday Strategy | 400 | 0.65% | 75% | 2.7 | 7.9% | 12% | 63% | -18% |
| 82 | S&P 500 | Turn of the Month Strategy | 650 | 0.65% | 62% | 2 | 6.3% | 24% | 26% | -28% |
| 83 | SMH | Ultimate Oscillator Strategy | 311 | 0.85% | 70% | 2.2 | 10.4% | 20% | 50% | -46% (!) |
| 84 | SPY | Double Seven Trading Strategy | 370 | 0.6% | 77% | 2.2 | 6.8% | 28% | 24% | -14% |
| 85 | IWM | Overnight Strategy for Russell 2000 | 152 | 0.31% | 77% | 4 | 2% | 2.5% | 79% | -2% |
| 86 | UGA | Overnight Strategy for Gasoline (Seasonal) | 123 | 0.6% | 62% | 2.2 | 4.3% | 2.5% | 177% | -7% |
| 87 | QQQ | Combined: Trend Following + Mean Reversion | 99 | 4.4% | 66% | 3 | 15% | 72% | 21% | -32% |
| 88 | SPY/TLT | Combined: Seasonal Effects (Stocks & Bonds) | 467 | 0.5% | 63% | 1.7 | 5.5% | 22% | 24% | -7% |
| 89 | SPY | First Trading Day Of The Month Strategy | 76 | 0.7% | 76% | 3 | 1.7% | 2.4% | 68% | -6% |
| 90 | QQQ | Combined: Trend Following + Mean Reversion | 237 | 1.8% | 51% | 3.2 | 14% | 79% | 17% | -50% |
| 91 | QQQ | Day Of Week Effect On Stocks | 458 | 0.85% | 76% | 2.7 | 15% | 25% | 58% | -27% |
| 92 | QQQ | Short (Tail Risk) Trading Strategy | 156 | 1.2% | 67% | 2 | 7.2% | 10% | 75% | -23% |
| 93 | TLT | Short Trading Strategy In Bonds | 215 | 0.3% | 59% | 1.7 | 2.5% | 12% | 21% | -10% |
| 95 | SPY | 24-hour (Overnight) Strategy SPY/QQQ | 405 | 0.4% | 63% | 2.2 | 5.1% | 5% | 102% | -7% |
| 96 | BTC-USD | Seasonal Strategy For Bitcoin | 103 | 2.7% | 60% | 2.3 | 28% | 10% | 280% | -20% |
| 97 | GLD | Long Pullback Strategy for Gold | 90 | 0.75% | 73% | 2.5 | 3.3% | 5% | 58% | -8% |
| 98 | SPY | Long Bear Market Strategy for S&P 500 | 197 | 0.6% | 73% | 2 | 3.6% | 4% | 84% | -16% |
| 99 | SPY | Short Strategy for S&P 500 | 147 | 0.75% | 69% | 2.1 | 3.3% | 7.5% | 45% | -11% |
| 100 | GLD | Long Gold Strategy | 214 | 0.45% | 58% | 1.6 | 4.5% | 21% | 22% | -15% |


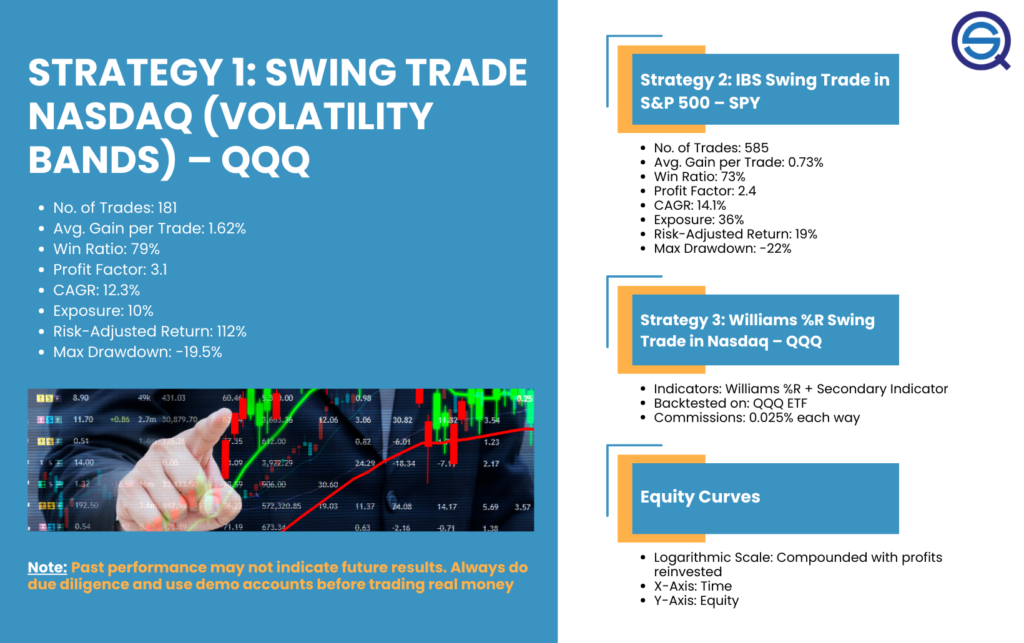
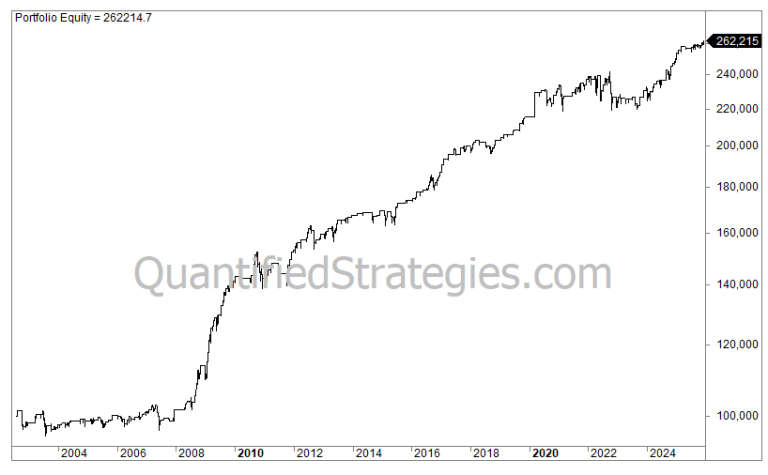
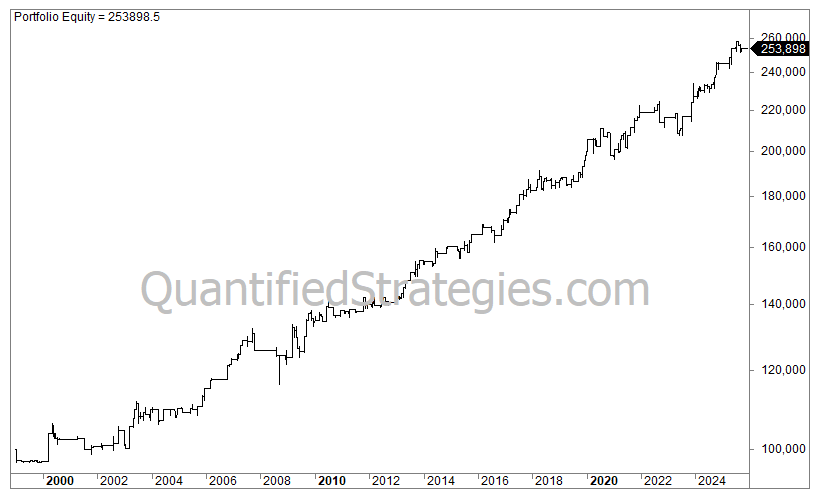
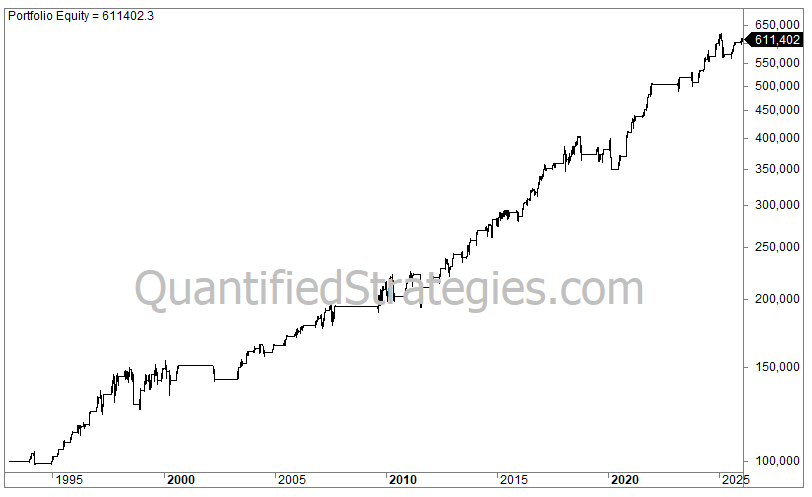
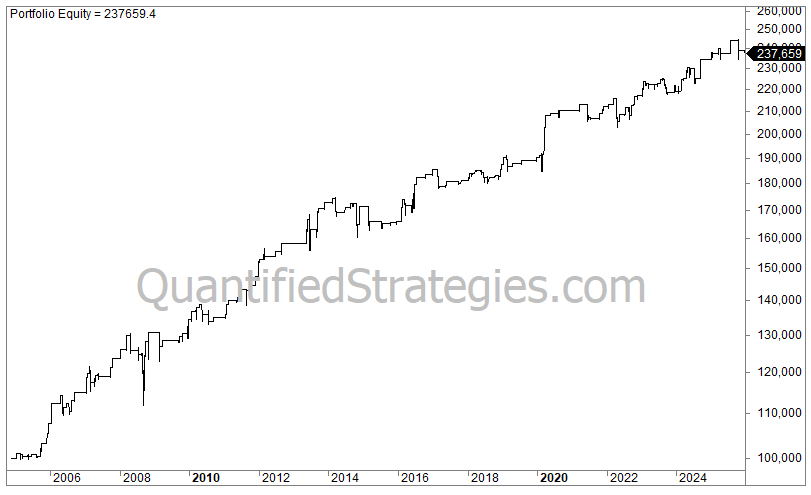
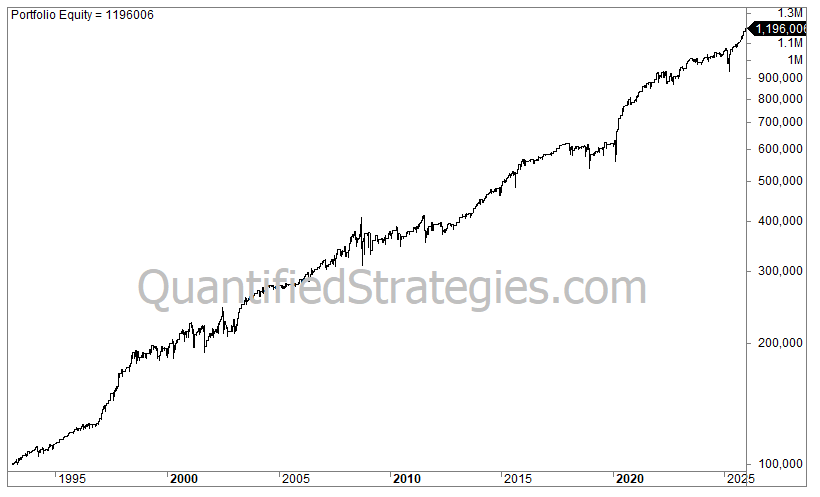
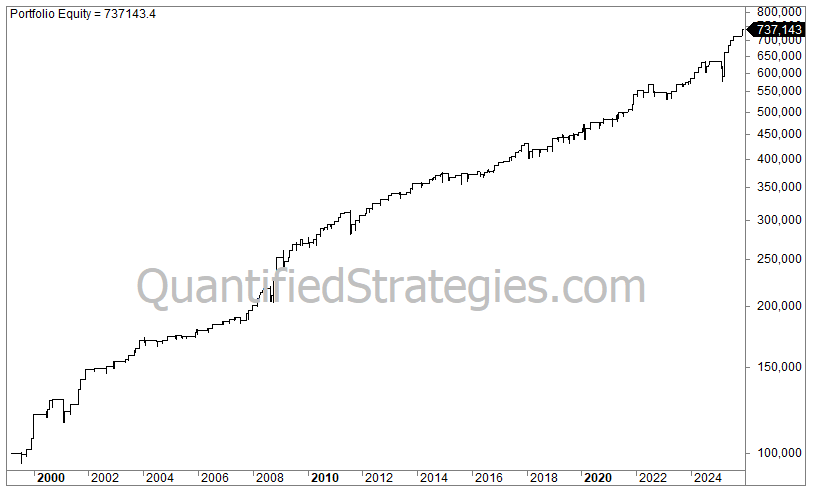
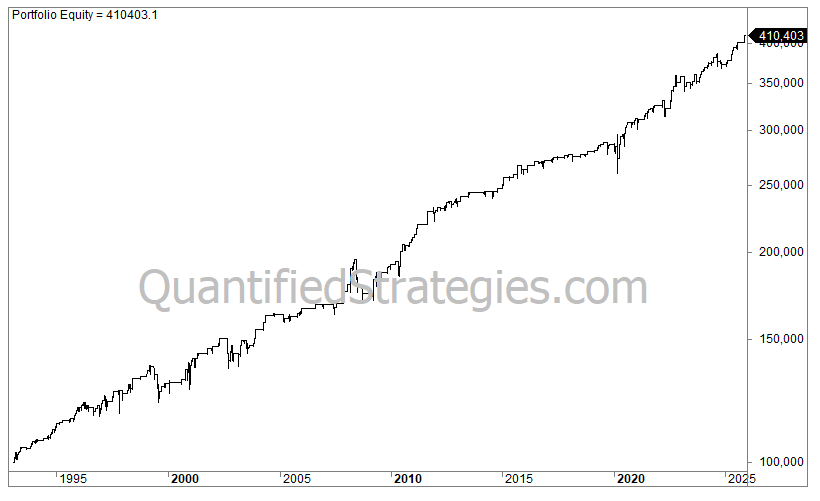
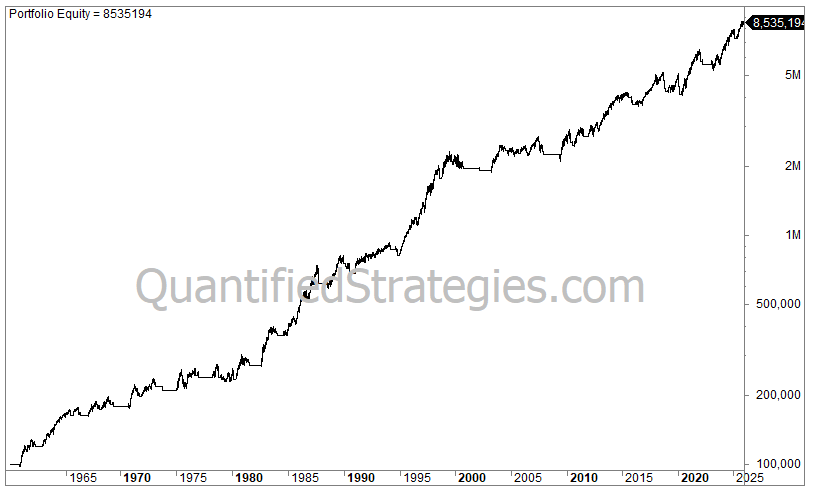
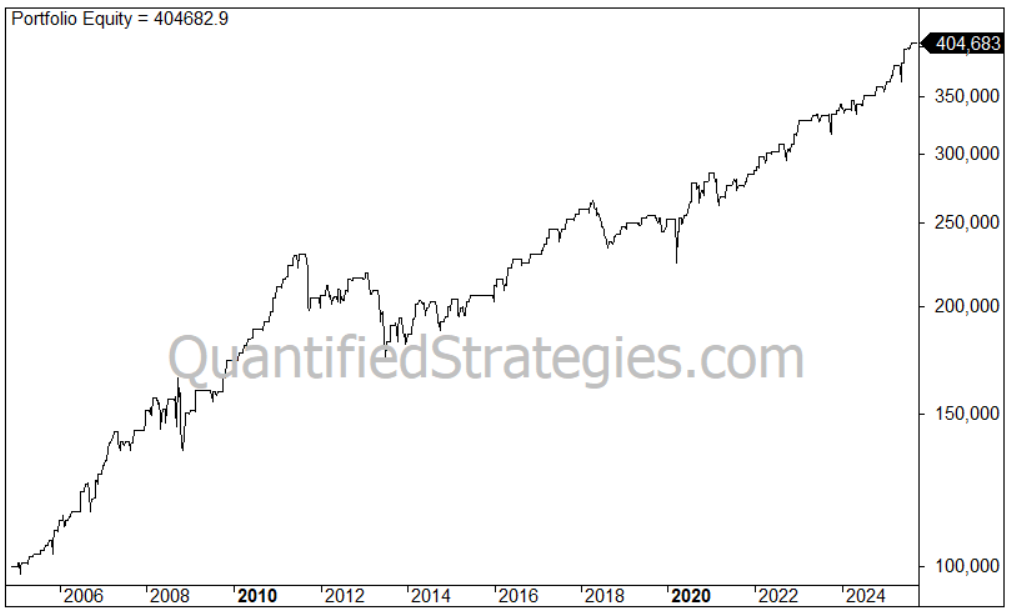
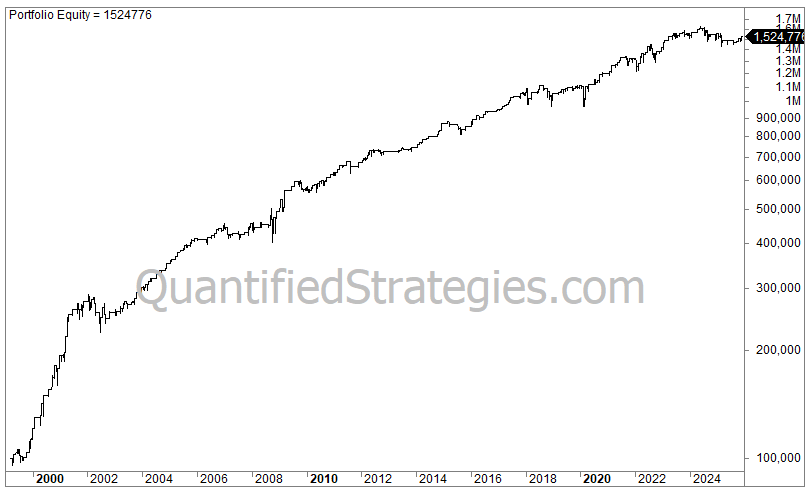
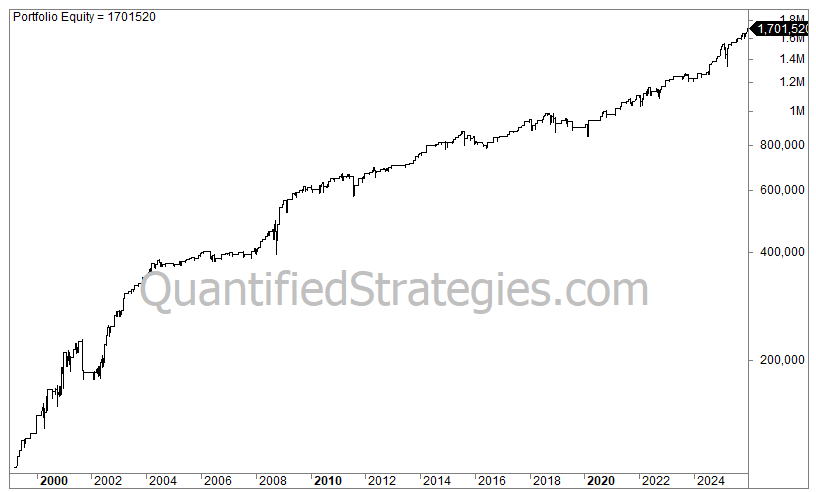
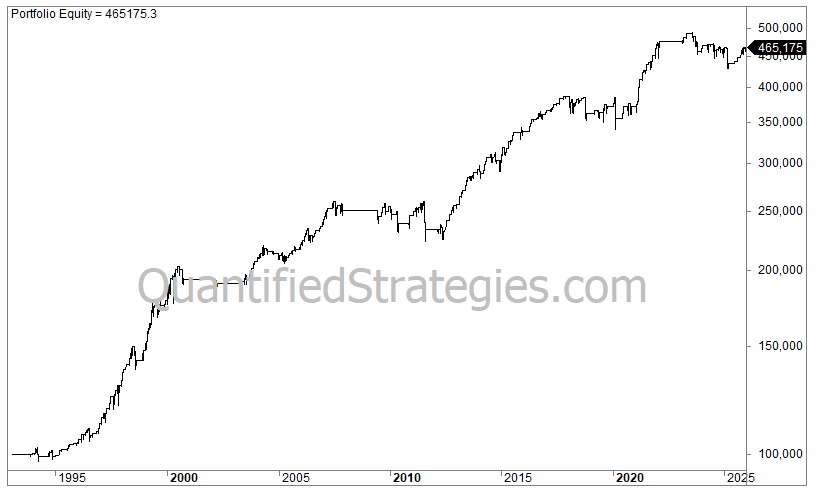
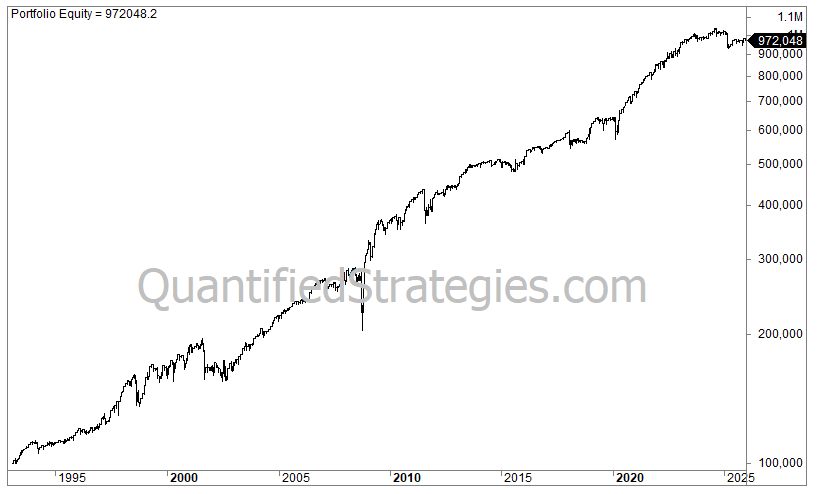
Strategy 1: Swing Trade Nasdaq (volatility bands)
The strategy uses volatility bands but additionally uses two other criteria. Backtested on the ETF that tracks Nasdaq 100 (QQQ).
The strategy was our monthly Trading Edge for August 2021 (but published a few years before that).
Statistics and figures (QQQ) – including commissions and slippage of 0.03% per trade:
- No. of trades: 189
- Average gain per trade: 1.6%
- Win ratio: 80%
- Profit factor: 3.1
- Annual returns (CAGR): 12.1%
- Exposure/time in the market: 11%
- Risk-adjusted return: 110% (CAGR divided by time spent in the market (0.1))
- Max drawdown: -19.5%
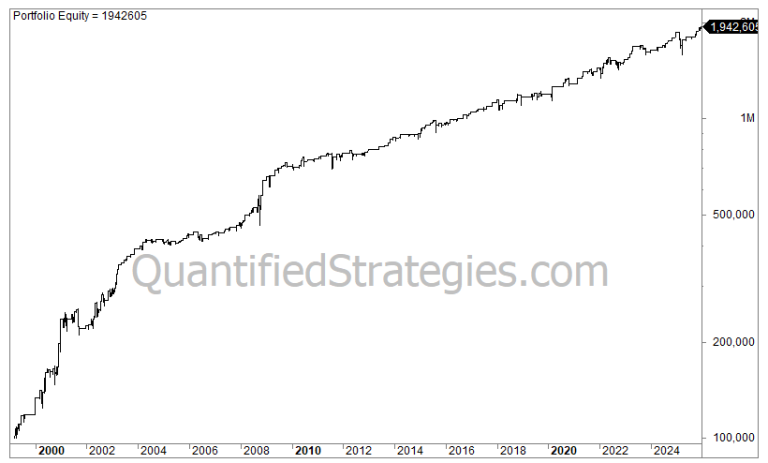
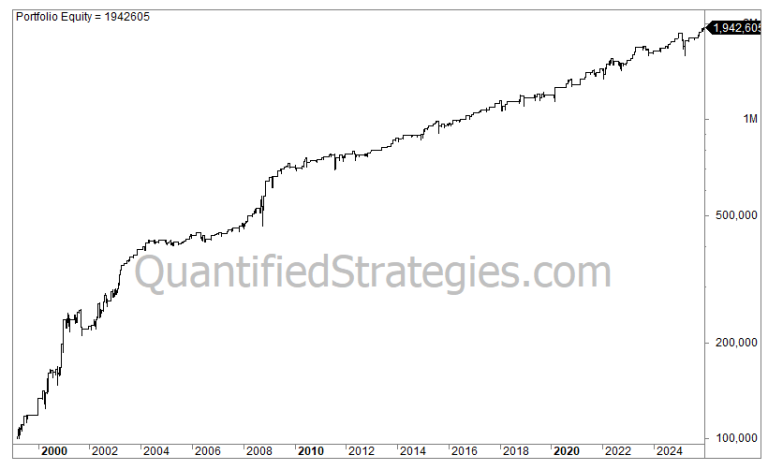
The equity curve (log scale) on QQQ:

Order by clicking here (check for strategy no.1):

Once you have paid you can download the strategy on this link.

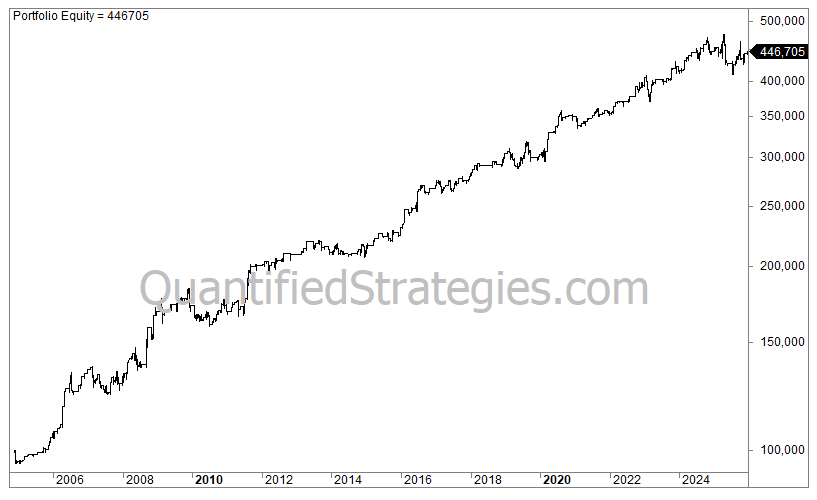
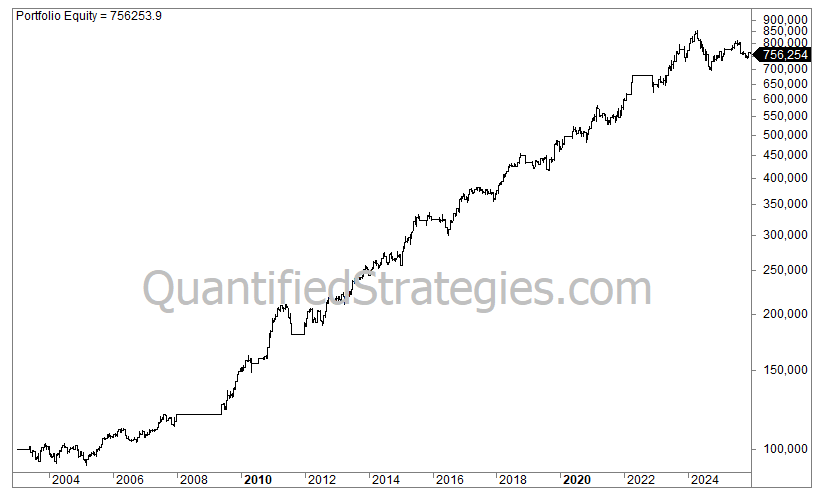
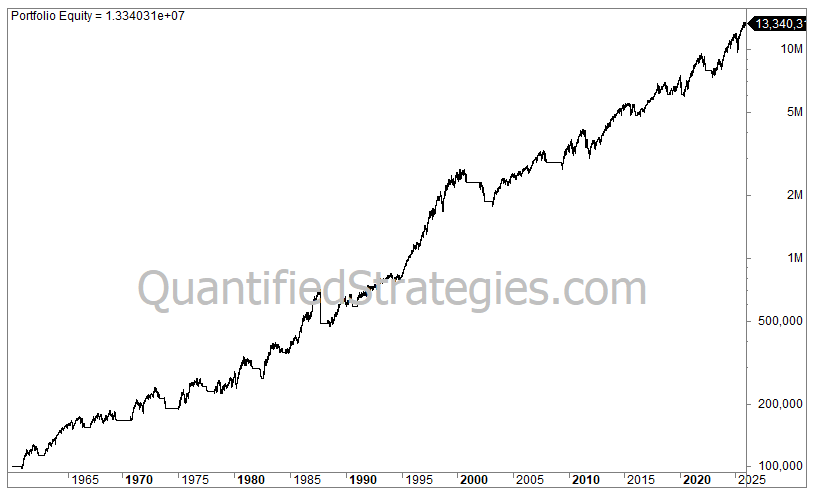
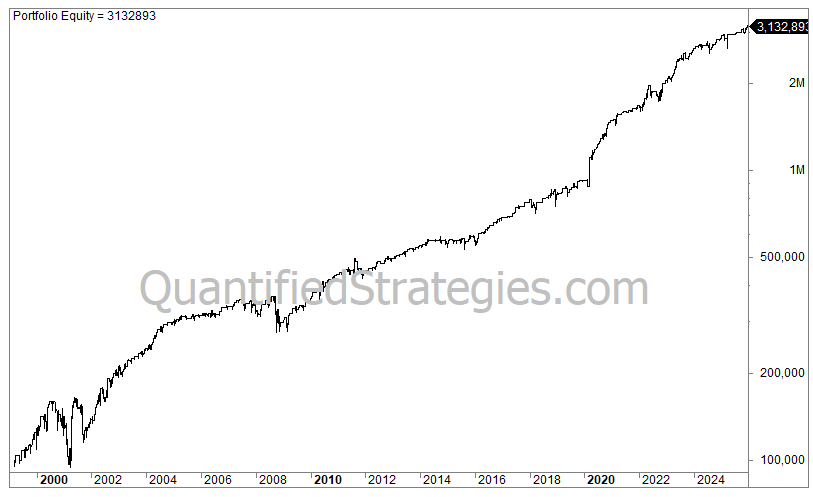
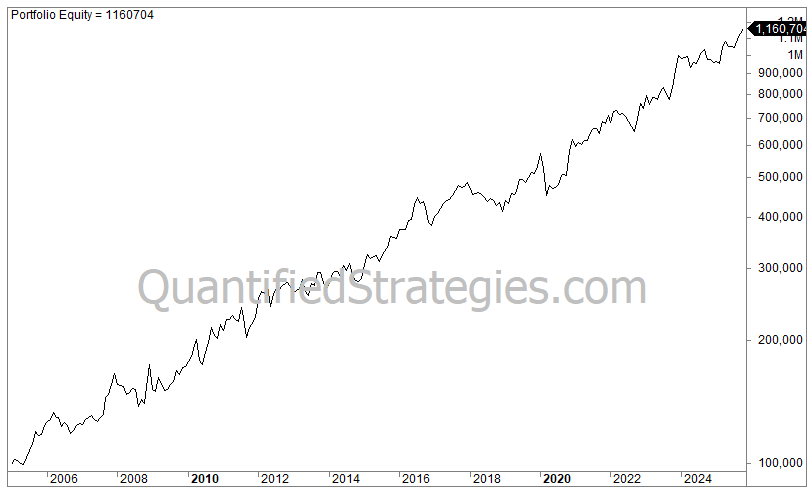
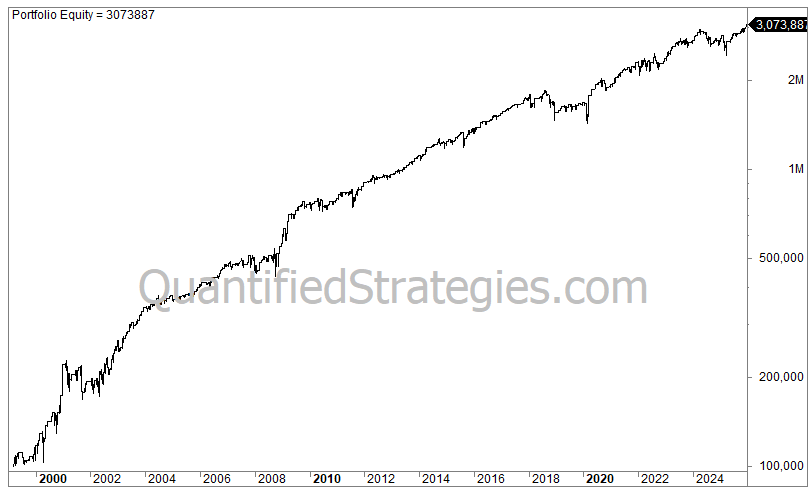
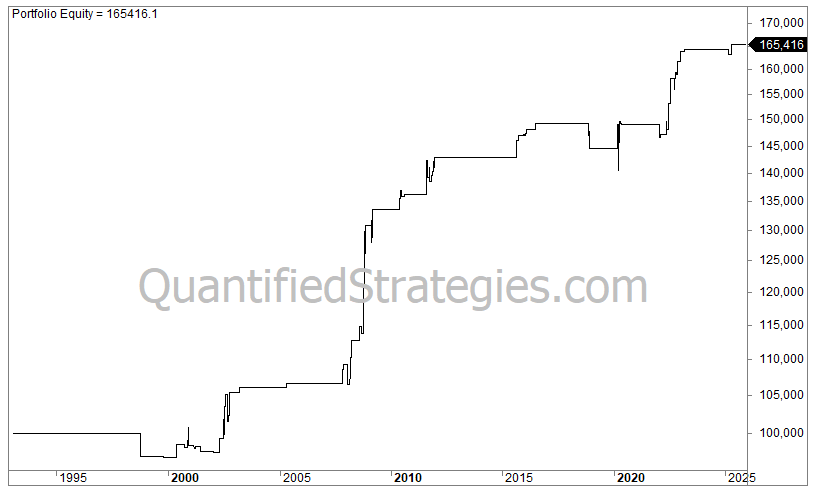
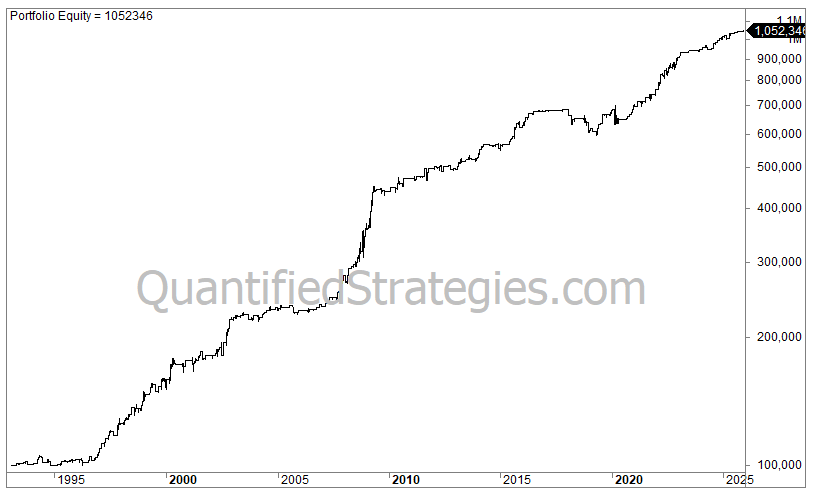
Strategy 2: IBS Swing Trade in the S&P 500
The strategy uses the IBS indicator, but we made a small twist. Backtested on the ETF that tracks S&P 500 (SPY).
The strategy was our monthly Trading Edge for October 2021.
Statistics and figures (SPY) – including 0.03% commissions and slippage per trade:
- No. of trades: 596
- Average gain per trade: 0.77%
- Win ratio: 73%
- Profit factor: 2.2
- Annual returns (CAGR): 14.5%
- Exposure/time in the market: 36%
- Risk-adjusted return: 40% (CAGR divided by time spent in the market (0.36))
- Max drawdown: -22%
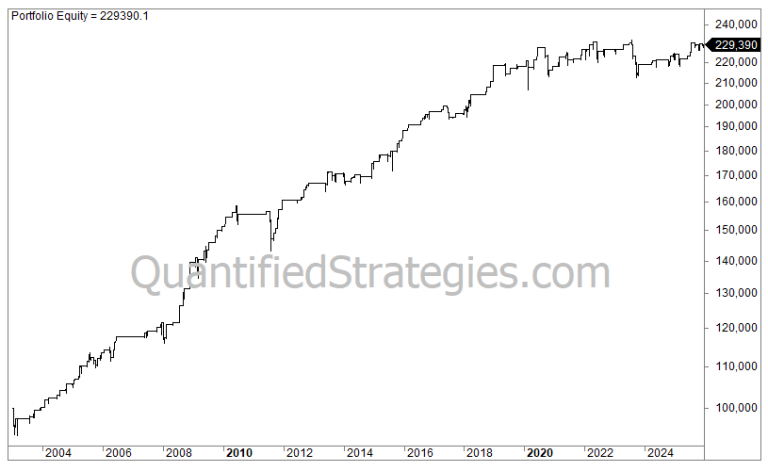
The equity curve (log scale) in SPY:
Order by clicking here (check for strategy no.2):
Once you have paid you can download the strategy on this link.
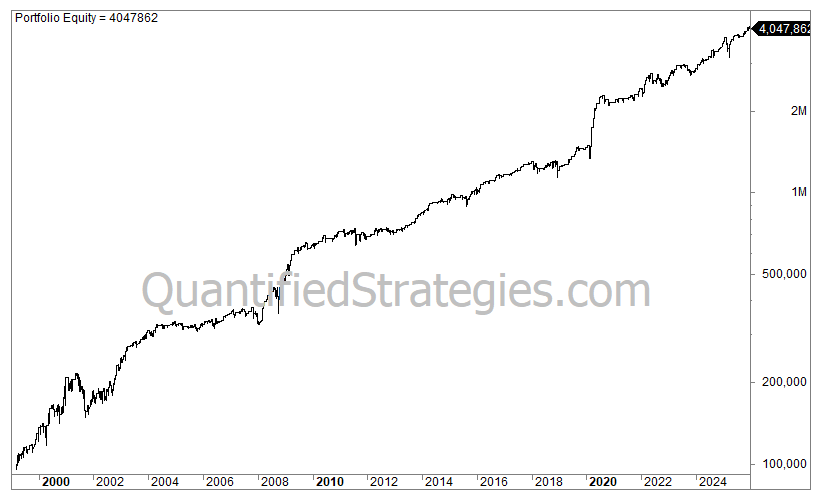
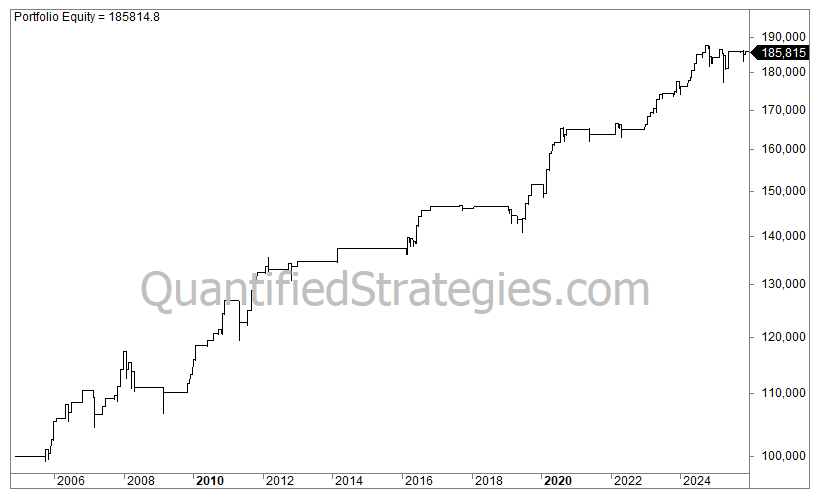
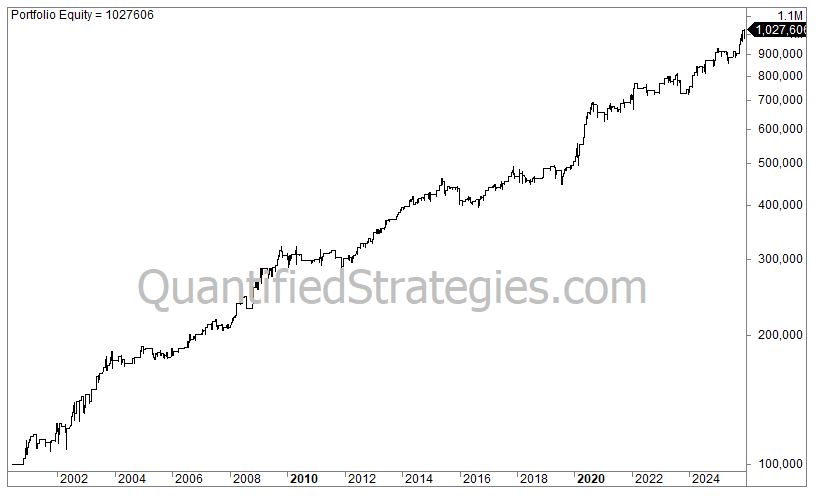
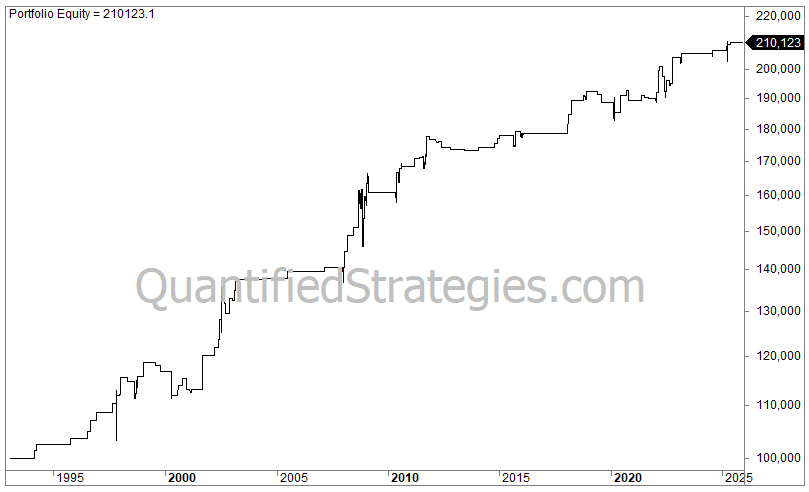
Strategy 3: Williams R% Swing Trade in Nasdaq
The strategy uses the famous and handy Williams %R indicator, but we added a second indicator. Backtested on the ETF that tracks Nasdaq 100 (QQQ). Commissions of 0.025% each way are included.
Published October 2021.
Statistics and figures (QQQ) – including 0.03% commissions and slippage per trade:
- No. of trades: 255
- Average gain per trade: 1.1%
- Win ratio: 75%
- Profit factor: 2.8
- Annual returns (CAGR): 11.4%
- Exposure/time in the market: 14%
- Risk-adjusted return: 81% (CAGR divided by time spent in the market (0.14))
- Max drawdown: -20%
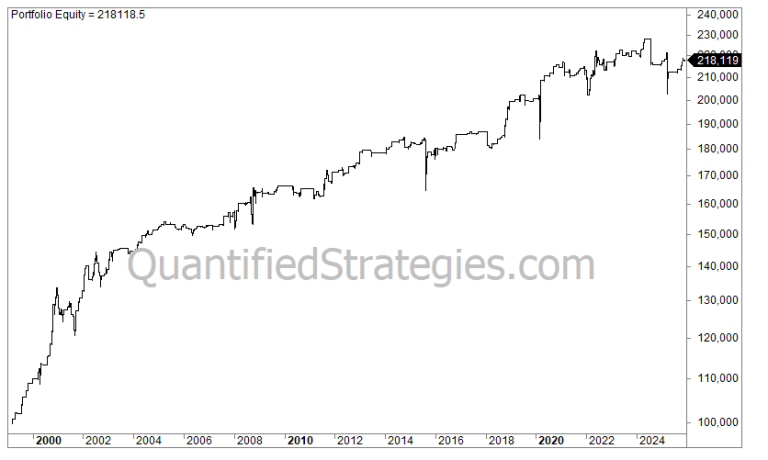
The equity curve (log scale) in QQQ:
Order by clicking here (check for strategy no.3):
Once you have paid you can download the strategy on this link.
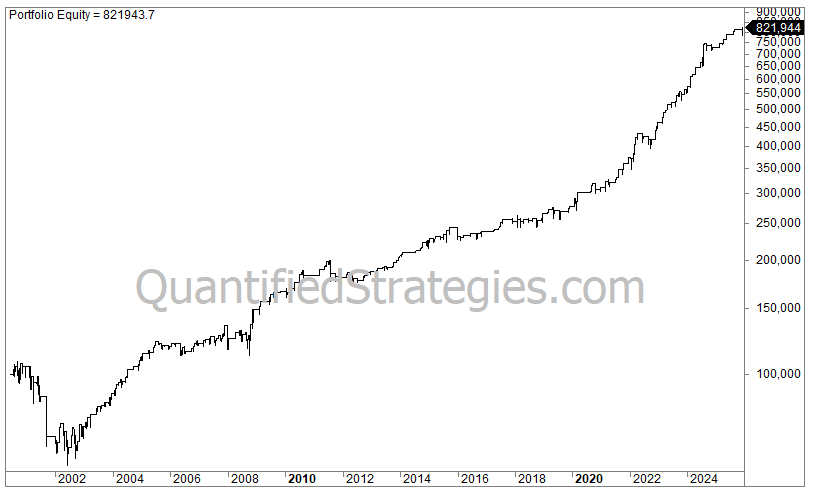
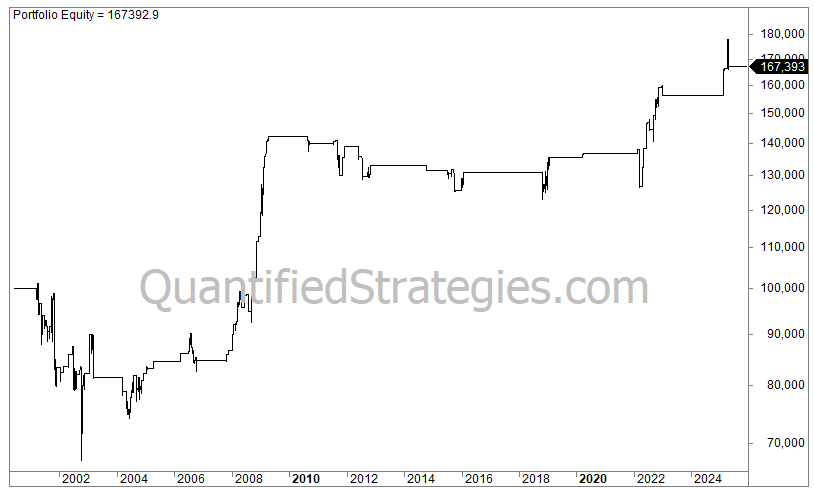
Strategy 4: Two Indicator Swing Trade Strategy (Nasdaq – QQQ)
The strategy uses the widely used IBS indicator, but we added a second indicator. Backtested on the ETF that tracks Nasdaq 100 (QQQ).
Published October 2020.
Statistics and figures (QQQ – including commissions and slippage of 0.03% per trade):
- No. of trades: 232
- Average gain per trade: 1.2%
- Win ratio: 73%
- Profit factor: 2.7
- Annual returns (CAGR): 10.7%
- Exposure/time in the market: 14%
- Risk-adjusted return: 76% (CAGR divided by time spent in the market (0.14))
- Max drawdown: -19%
The equity curve (log scale) in QQQ:
Order by clicking here (check for strategy no.4):
Once you have paid you can download the strategy on this link.
Strategy 5: Double Indicator Swing Trade in Nasdaq
The strategy uses the often ignored ADX indicator. We backtest the ADX indicator alongside another indicator. Backtested on the ETF that tracks Nasdaq 100 (QQQ).
Published October 2020.
Statistics and figures (QQQ) – including commissions and slippage of 0.03% per trade:
- No. of trades: 285
- Average gain per trade: 1.0%
- Win ratio: 75%
- Profit factor: 2.5
- Annual returns (CAGR): 11%
- Exposure/time in the market: 17%
- Risk-adjusted return: 66% (CAGR divided by time spent in the market (0.16))
- Max drawdown: -25%
The equity curve (log scale) in QQQ:
Order by clicking here (check for strategy no.5):
Once you have paid you can download the strategy on this link.
Strategy 6: 23 Candlestick formations
We have Amibroker code for 23 candlestick formations (If you want Tradestation code for all 75 candlesticks, click here). Please check out this candlestick article where we tested these 23 formations. The candlesticks are put down into trading rules and backtested on S&P 500 (SPY).
Published December 2021.
Order by clicking here (check for strategy no.6):
Once you have paid you can download the strategy on this link.
Strategy 7: XLP swing trade
The ETF XLP tracks consumer stocks like Wal-Mart, Procter&Gamble, etc. Its movements are different than the main stock indices.
We have made a backtest that generates signals in XLP based on another relevant ETF.
This strategy was our monthly Trading Edge for May 2021.
Statistics and figures (XLP) – including commissions and slippage of 0.03% per trade:
- No. of trades: 477
- Average gain per trade: 0.35%
- Win ratio: 72%
- Profit factor: 1.8
- Annual returns (CAGR): 8.1%
- Exposure/time in the market: 32%
- Risk-adjusted return: 20% (CAGR divided by time spent in the market (0.32))
- Max. drawdown: -15%
The equity curve (log scale):

Order by clicking here (check for strategy no.7):
Once you have paid you can download the strategy on this link.
Strategy 8: XLP Swing Trade
The ETF XLP tracks consumer stocks like Wal-Mart, Procter&Gamble, etc. Its movements are different than the main stock indices.
The strategy has code for Amibroker and Tradestation/Easy Langauge.
The strategy is based on two variables.
The strategy was our monthly Trading Edge for April 2021.
Statistics and figures (XLP) – including commissions and slippage of 0.03% per trade:
- No. of trades: 163
- Average gain per trade: 0.5%
- Win ratio: 80%
- Profit factor: 2.2
- Annual returns (CAGR): 3.6%
- Exposure/time in the market: 10%
- Max. drawdown: -10%
The equity curve (log scale):
Order by clicking here (check for strategy no.8):
Once you have paid you can download the strategy on this link.
Strategy 9: Overnight Edge in Nasdaq
The strategy buys at the close and sells on the next open. The strategy is based on two variables. Backtested on the ETF that tracks Nasdaq 100 (QQQ).
This strategy was our monthly Trading Edge for March 2021.
Statistics and figures (QQQ) – including commissions and slippage of 0.03% per trade:
- No. of trades: 474
- Average gain per trade: 0.15%
- Win ratio: 60%
- Profit factor: 1.5
- Annual returns (CAGR): 2.9%
- Exposure/time in the market: 7.3%
- Max. drawdown: -10%
The equity curve (log scale):
Order by clicking here (check for strategy no.9):
Once you have paid you can download the strategy on this link.
Strategy 10: End Of Month Overnight Edge In Nasdaq
The strategy buys at the close and sells on the next open (no matter what). The strategy is based on one variable. Backtested on the ETF that tracks Nasdaq 100 (QQQ).
This strategy was our monthly Trading Edge for February 2021.
Statistics and figures (QQQ) – including commissions and slippage of 0.03% per trade:
- No. of trades: 192
- Average gain per trade: 0.18%
- Win ratio: 61%
- Profit factor: 1.9
- Annual returns (CAGR): 1.1%
- Exposure/time in the market: 3%
- Max. drawdown: -3%
The equity curve (log scale):

Order by clicking here (check for strategy no. 10):
Once you have paid you can download the strategy on this link.
Strategy 11: Seasonal Bond Trade (TLT)
The strategy is based on seasonality and has additionally two simple criteria based on where the close is in relation to the previous days. Backtested on the ETF that tracks bonds (TLT).
This strategy was our monthly Trading Edge for June 2021.
Statistics and figures (TLT) – including commissions and slippage of 0.03% per trade:
- No. of trades: 288
- Average gain per trade: 0.3%
- Win ratio: 70%
- Profit factor: 1.8
- Annual returns (CAGR): 3.7%
- Exposure/time in the market: 16%
- Max. drawdown: -9%
The equity curve (log scale):
Order by clicking here (check for strategy no.11):
Once you have paid you can download the strategy on this link.
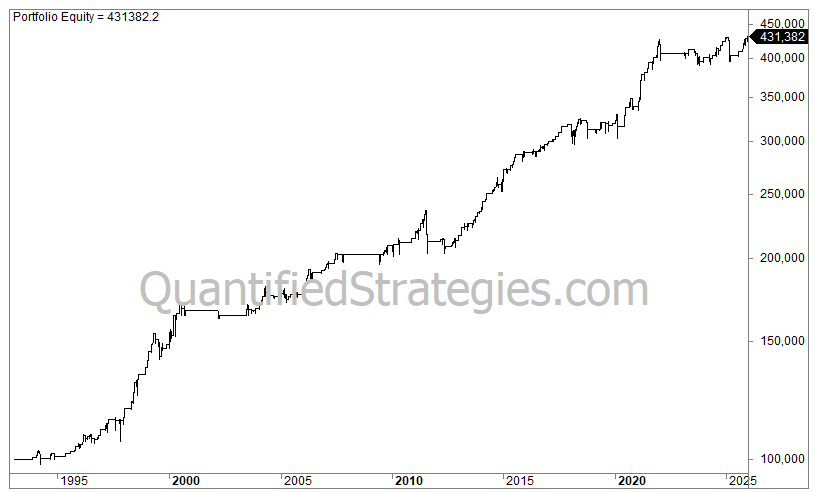
Strategy 12: Breakout Strategy (Long) In Gold (GLD)
The strategy is based on breakouts, entering at the close and exiting a few days later. There are three variables. Backtested on the ETF that tracks gold (GLD).
This strategy was our monthly Trading Edge for November 2023.
(Originally, we had an FXI strategy as #12, but we removed it due to zero interest.)
Statistics and figures (GLD) – including commissions and slippage of 0.03% per trade:
- No. of trades: 509
- Average gain per trade: 0.32%
- Win ratio: 76%
- Profit factor: 1.8
- Annual returns (CAGR): 8%
- Exposure/time in the market: 28%
- Risk-adjusted return: 28% (CAGR divided by time spent in the market (0.28))
- Max. drawdown: -13%
The equity curve (log scale):
Order by clicking here (check for strategy no.12):
Once you have paid you can download the strategy on this link.
Strategy 13: QQQ Collapse Trading Strategy
The strategy enters at the open and exits at the close based on two simple criteria. The holding period is short. Backtested on the ETF that tracks Nasdaq 100 (QQQ). It’s a long strategy.
This strategy was our monthly Trading Edge for January 2024.
Statistics and figures (QQQ) – including 0.03% commissions and slippage per trade:
- No. of trades: 400
- Average gain per trade: 0.56%
- Win ratio: 62%
- Profit factor: 1.7
- CAGR: 8.8%
- Exposure/time in the market: 10%
- Risk-adjusted return: 80% (CAGR divided by time spent in the market (0.1))
- Max. drawdown: -23%
The equity curve (log scale):
Order by clicking here (check for strategy no.13):
Once you have paid you can download the strategy on this link.
Strategy 14: Long Momentum Strategy for Nasdaq (QQQ)
The strategy can be labeled a momentum strategy. It has two parameters to buy and one for when to sell.
This strategy was our monthly Trading Edge for August 2025.
Statistics and figures (QQQ) – including 0.03% commissions and slippage per trade:
- No. of trades: 131
- Average gain per trade: 1.05%
- Win ratio: 82%
- Profit factor: 3
- CAGR: 5.3% (assuming no leverage)
- Exposure/time in the market: 15%
- Risk-adjusted return: 34% (CAGR divided by time spent in the market (0.15))
- Max. drawdown: -26%
The equity curve (log scale):
Order by clicking here (check for strategy no.14):
Once you have paid you can download the strategy on this link.
Strategy 15: Short swing trade in TLT (bonds)
The strategy has two variables for entry and exits after n days. Backtested on the ETF that tracks bonds (TLT).
This strategy was our monthly Trading Edge for December 2021.
Statistics and figures (TLT) – including commissions and slippage of 0.03% per trade:
- No. of trades: 211
- Average gain per trade: 0.47%
- Win ratio: 12%
- Profit factor: 1.8
- CAGR: 4.3% (assuming no leverage)
- Exposure/time in the market: 26%
- Risk-adjusted return: 16% (CAGR divided by time spent in the market (0.26))
- Max. drawdown: -13%
The equity curve (log scale):
Order by clicking here (check for strategy no.15):
Once you have paid you can download the strategy on this link.
Strategy 16: Long swing trade in XLU (utilities)
The strategy has two variables for entry and exit after n days. Backtested on the ETF that tracks utilities (XLU).
This strategy was our monthly Trading Edge for January 2022.
Statistics and figures (XLU) – including commissions and slippage of 0.03% per trade:
- No. of trades: 158
- Average gain per trade: 0.72%
- Win ratio: 62%
- Profit factor: 1.9
- Annual returns (CAGR): 4.3% (assuming no leverage)
- Exposure/time in the market: 14%
- Risk-adjusted returns: 30%
- Max. drawdown: -17%
The equity curve (log scale):
Order by clicking here (check for strategy no.16):
Once you have paid you can download the strategy on this link.
Strategy 17: Long volatility swing trade in SPY (S&P 500)
The strategy has two variables for entry and one for exit. The strategy is a volatility long strategy and about 65% of the trades enter on a day where the close is higher than the previous close, even high RSI. Backtested on the ETF that tracks S&P 500 (SPY).
This strategy was our monthly Trading Edge for February 2022.
Statistics and figures (SPY) – including commissions and slippage of 0.03% per trade:
- No. of trades: 363
- Average gain per trade: 0.4%
- Win ratio: 75%
- Profit factor: 2.1
- Annual returns (CAGR): 4.5% (assuming no leverage)
- Exposure/time in the market: 12%
- Risk-adjusted return: 36% (CAGR divided by time spent in the market (0.12))
- Max. drawdown: -19%
The equity curve (log scale):
Order by clicking here (check for strategy no.17):
Once you have paid you can download the strategy on this link.
Strategy 18: Overnight long trade in SPY (S&P 500)
The strategy has three variables for entry and one for exit. Entry is at the close and the exit is at the close the next day. Backtested on the ETF that tracks S&P 500 (SPY).
This strategy was our monthly Trading Edge for March 2022.
Statistics and figures (SPY) – including commissions and slippage of 0.03% per trade:
- No. of trades: 374
- Average gain per trade: 0.28%
- Win ratio: 60%
- Profit factor: 1.6
- CAGR: 3.1% (assuming no leverage)
- Exposure/time in the market: 5%
- Risk-adjusted returns: 68%
- Max. drawdown: -16%
The equity curve (log scale):
Order by clicking here (check for strategy no.18):
Once you have paid you can download the strategy on this link.
Strategy 19: Short Swing Strategy Semiconductors SMH
The strategy has two variables for both short entry and short covering.
The strategy works well for SPY (S&P 500) and IWM (Russell 2000) as well.
This strategy was our monthly Trading Edge for May 2024.
Statistics and figures (SMH) – including commissions and slippage of 0.03% per trade:
- No. of trades: 109
- Average gain per trade: 0.79%
- Win ratio: 75%
- Profit factor: 2.4
- Annual returns (CAGR): 3.5% (assuming no leverage)
- Exposure/time in the market: 3%
- Risk-adjusted return: 110% (CAGR divided by time spent in the market (0.03))
- Max. drawdown: -12%
The equity curve (log scale):
Order by clicking here (check for strategy no.19):
Once you have paid you can download the strategy on this link.
Strategy 20: Overnight long trade in SPY (S&P 500)
The strategy has three variables for entry (seasonal trading strategy) and one for the exit. Entry is at the open and the exit is at the close the next day. Backtested on the ETF that tracks S&P 500 (SPY).
This strategy was our monthly Trading Edge for May 2022.
Statistics and figures (SPY): – including commissions and slippage of 0.03% per trade
- No. of trades: 318
- Average gain per trade: 0.37%
- Win ratio: 62%
- Profit factor: 2
- Annual returns (CAGR): 3.5%
- Exposure/time in the market: 4%
- Risk-adjusted return: 90% (CAGR divided by time spent in the market (0.04))
- Max. drawdown: -8%
The equity curve (log scale):
Order by clicking here (check for strategy no.20):
Once you have paid you can download the strategy on this link.
Strategy 21: Long swing trade in QQQ (Nasdaq)
The strategy has three variables for entry and one for exit. Entry is at the close and the exit is at the close one or more trading days later. Backtested on the ETF that tracks Nasdaq 100 (QQQ).
This strategy was our monthly Trading Edge for June 2022.
Statistics and figures (QQQ) – including commissions and slippage of 0.03% per trade:
- No. of trades: 189
- Average gain per trade: 0.75%
- Win ratio: 72%
- Profit factor: 2.1
- Annual returns (CAGR): 6.0% (assuming no leverage)
- Exposure/time in the market: 12%
- Risk-adjusted return: 49%
- Max. drawdown: -19%
The equity curve (log scale):
Order by clicking here (check for strategy no.21):
Once you have paid you can download the strategy on this link.
Strategy 22: Long overnight trade in QQQ/SPY (Nasdaq/SP500)
The strategy has two variables for entry and one for exit. Entry is at the close and the exit is at the close of the next trading day. You hold it for 24 hours only. Backtested on the ETF that tracks Nasdaq 100 (QQQ).
This strategy was our monthly Trading Edge for July 2022.
Statistics and figures (QQQ) – including commissions and slippage of 0.03% per trade:
- No. of trades: 431
- Average gain per trade: 0.55%
- Win ratio: 61%
- Profit factor: 1.9
- Annual returns (CAGR): 9% (assuming no leverage)
- Exposure/time in the market: 6%
- Risk-adjusted return: 135%
- Max. drawdown: -12%
The equity curve (log scale QQQ):

Order by clicking here (check for strategy no.22):
Once you have paid you can download the strategy on this link.
Strategy 23: Short swing trade XLP
The strategy has five variables for entry and two for exit. Entry is at the close and the average holding time is 2.7 days. Backtested on the ETF that tracks consumer staples (XLP).
This strategy was our monthly Trading Edge for August 2022.
Statistics and figures (XLP) – including commissions and slippage of 0.03% per trade:
- No. of trades: 210
- Average gain per trade: 0.3%
- Win ratio: 69%
- Profit factor: 2.1
- Annual returns (CAGR): 2.1% (assuming no leverage)
- Exposure/time in the market: 6%
- Risk-adjusted return: 36%
- Max. drawdown: -6%
The equity curve (log scale):
Order by clicking here (check for strategy no.23):
Once you have paid you can download the strategy on this link.
Strategy 24: Long swing trade XLV/XLU
The strategy has three variables for entry and two for exit. It’s a seasonal strategy. Entry is at the open and exit is after 4 or 5 days. Backtested on the ETF that tracks healthcare stocks (XLV).
This strategy was our monthly Trading Edge for September 2022.
Statistics and figures (XLU) – including commissions and slippage of 0.03% per trade:
- No. of trades: 174
- Average gain per trade: 0.5%
- Win ratio: 62%
- Profit factor: 2
- Annual returns (CAGR): 3.1% (assuming no leverage)
- Exposure/time in the market: 9%
- Max. drawdown: -12%
- Risk-adjusted return: 32% (CAGR divided by time spent in the market (0.09))
The equity curve (log scale – XLU – dividends included):
Order by clicking here (check for strategy no.24):
Once you have paid you can download the strategy on this link.
Strategy 25: Long and short swing trade TLT (Long-Term Treasuries)
Both long and short are based on seasonal anomaly strategies. Entry is at the close and exit is after a few days. Backtested on the ETF that tracks bonds (TLT).
This strategy was our monthly Trading Edge for October 2022.
Statistics and figures (TLT) – including commissions and slippage of 0.03% per trade:
- No. of trades: 440
- Average gain per trade: 0.4%
- Win ratio: 62%
- Profit factor: 1.7
- Annual returns (CAGR): 9.2% (assuming no leverage)
- Exposure/time in the market: 37%
- Risk-adjusted returns: 45%
- Max. drawdown: -18%
The equity curve (log scale):
Order by clicking here (check for strategy no. 25):
Once you have paid you can download the strategy on this link.
Strategy 26: Long QQQ volatility strategy
This strategy was our monthly Trading Edge for June 2025.
(Strategy 26 was previously a DAX strategy. The strategy has been moved to future strategies.)
Statistics and figures (QQQ – commissions and slippage of 0.03% trade is included):
- No. of trades: 324
- Average gain per trade: 0.95%
- Win ratio: 75%
- Profit factor: 2.3
- CAGR: 12.6% (assuming no leverage)
- Exposure/time in the market: 20%
- Risk-adjusted return: 62% (annual return divided by time spent in the market(0.2))
- Max drawdown: -23%
The equity curve (log scale):
Order by clicking here (check for strategy no. 26):
Once you have paid you can download the strategy on this link.
Strategy 27: Long holiday swing trade S&P 500 (SPY)
This strategy was our monthly Trading Edge for December 2022. Backtested on the ETF that tracks S&P 500 (SPY).
Statistics and figures (SPY) – including commissions and slippage of 0.03 per trade:
- No. of trades: 123
- Average gain per trade: 0.3%
- Win ratio: 60%
- Profit factor: 2
- Annual returns (CAGR): 1.2% (assuming no leverage)
- Exposure/time in the market: 2%
- Risk-adjusted return: 60%
- Max. drawdown: -7%
The equity curve (log scale):
Order by clicking here (check for strategy no. 27):
Once you have paid you can download the strategy on this link.
Strategy 28: End of Month Trading Strategy for Equity ETFs
This strategy was our monthly Trading Edge for February 2026. The strategy holds the position for one month.
Statistics and figures (SPY) – including commissions and slippage of 0.03% per trade:
- No. of trades: 128
- Average gain per trade: 1.5%
- Win ratio: 72%
- Profit factor: 2.5
- Annual returns (CAGR): 5.6%
- Exposure/time in the market: 32%
- Risk-adjusted return: 17%
- Max. drawdown: -16%
The equity curve (log scale):
Order by clicking here (check for strategy no. 28):
Once you have paid you can download the strategy on this link
Strategy 29: Long swing trade real estate stocks (VNQ)
This strategy was our monthly Trading Edge for February 2023. Backtested on the ETF that tracks real estate stocks (VNQ).
Statistics and figures (VNQ) – including commissions and slippage of 0.03% per trade:
- No. of trades: 375
- Average unleveraged gain per trade: 0.82%
- Win ratio: 61%
- Profit factor: 2.1
- Annual returns (CAGR): 14.5% (assuming no leverage)
- Exposure/time in the market: 51%
- Risk-adjusted return:28%
- Max. drawdown: -33%
The equity curve (log scale):
Order by clicking here (check for strategy no. 29):
Once you have paid you can download the strategy on this link
Strategy 30: Long swing trade Treasury bonds (TLT)
This strategy was our monthly Trading Edge for March 2023. Backtested on the ETF that tracks bonds (TLT).
Statistics and figures (TLT) – including commissions and slippage of 0.03% per trade:
- No. of trades: 242
- Average unleveraged gain per trade: 0.31%
- Win ratio: 69%
- Profit factor: 2
- Annual returns (CAGR): 3.3% (assuming no leverage)
- Exposure/time in the market: 13%
- Risk-adjusted return: 24%
- Max. drawdown: -9%
The equity curve (log scale):
Order by clicking here (check for strategy no. 30):
Once you have paid you can download the strategy on this link
Strategy 31: Trading Volume Strategy (Nasdaq 100)
This strategy was our monthly Trading Edge for January 2026.
The strategy has code for Amibroker and Tradestation/Easy Langauge.
The strategy buys the next open after the signal.
Statistics and figures (QQQ), including commissions of 0.03% per trade:
- No. of trades: 225
- Average unleveraged gain per trade: 1.4%
- Win ratio: 79%
- Profit factor: 3.5
- CAGR: 12.5% (assuming no leverage)
- Exposure/time in the market: 10%
- Risk-adjusted returns: 127%
- Max. drawdown: -19%
The equity curve (log scale):
Order by clicking here (check for strategy no. 31):
Once you have paid you can download the strategy on this link
Strategy 32: Long swing trade GLD (gold)
This strategy was our monthly Trading Edge for May 2023. Backtested on the ETF that tracks gold (GLD). Gold is a useful strategy diversifier, but very hard to trade as strategies frequently “break down”.
The strategy has code for Amibroker and Tradestation/Easy Langauge.
Statistics and figures (GLD) – including commissions and slippage of 0.03% per trade:
- No. of trades: 179
- Average unleveraged gain per trade: 0.5%
- Win ratio: 71%
- Profit factor: 2.1
- Annual returns (CAGR): 4.4% (assuming no leverage)
- Exposure/time in the market: 10%
- Risk-adjusted return: 42%
- Max. drawdown: -14%
The equity curve (log scale):
Order by clicking here (check for strategy no. 32):
Once you have paid you can download the strategy on this link.
Strategy 33: (Bundle 1) S&P 500 Trading Strategies (SPY Bundle)
Please check our separate landing page for strategy bundles. Trading rules in plain English and code for Amibroker, Tradestation/Multicharts, and TradingView. Eligible as a “bundle pick” for the memberships.
Published spring 2022.
Strategy 34: (Bundle 2) Volatility Trading Strategies (SPY Bundle)
Please check our separate landing page for strategy bundles. Eligible as a “bundle pick” for the memberships.
Backtested on the ETF that tracks S&P 500 (SPY).
Published spring 2022.
Strategy 35: (Bundle 3) Short Selling Strategies (Bundle)
Please check our separate landing page for strategy bundles. Trading rules in plain English and code for Amibroker, Tradestation/Multicharts, and TradingView. Eligible as a “bundle pick” for the memberships.
The strategies are backtested on SPY, SMH, and XLP.
Published spring 2022.
Strategy 36: (Bundle 4) Seasonal Strategies (The Holiday Trading Bundle for S&P 500/SPY)
Please check our separate landing page for strategy bundles. Trading rules and plain English and code for Amibroker. Not eligible for any of the membership strategy selections. Backtested on SPY.
Published autumn 2022.
Strategy 37: (40+) Futures Strategies
Please check our separate landing page for futures trading strategies. Not eligible for any of the membership strategy selections.
Strategy 38: RSI Trading Strategy (S&P 500- SPY)
A short-term trading strategy based on the RSI indicator. Backtested on the ETF that tracks S&P 500 (SPY).
Published first time around 2016/17.
The strategy has code for Amibroker, Tradestation/Easy Langauge, and TradingView/Pinescript.
Statistics and figures (SPY – S&P 500) – including commissions and slippage of 0.03% per trade:
- No. of trades: 402
- Average unleveraged gain per trade: 0.6%
- Win ratio: 73%
- Profit factor: 2.3
- Annual returns (CAGR): 7.9% (assuming no leverage)
- Exposure/time in the market: 13%
- Risk-adjusted return: 57% (CAGR divided by time spent in the market (0.13))
- Max. drawdown: -16%
The equity curve (log scale):
Order by clicking here (check for strategy no. 38):
Once you have paid you can download the strategy on this link.
Strategy 39: Stochastic Indicator Trading Strategy (S&P 500 – SPY)
A short-term trading strategy based on the Stochastic indicator. Backtested on the ETF that tracks S&P 500 (SPY).
Published first time around 2016/17.
The strategy has code for Amibroker, Tradestation/Easy Langauge, and TradingView/Pinescript.
Statistics and figures (SPY – S&P 500) – including commissions and slippage of 0.03% per trade:
- No. of trades: 397
- Average unleveraged gain per trade: 0.5%
- Win ratio: 72%
- Profit factor: 2.2
- CAGR/annual returns: 6.2%(assuming no leverage)
- Exposure/time in the market: 13%
- Risk-adjusted return: 47% (CAGR divided by time spent in the market (0.13))
- Max. drawdown: -20%
The equity curve (log scale):
Order by clicking here (check for strategy no. 39):
Once you have paid you can download the strategy on this link.
Strategy 40: MACD (Histogram) Trading Strategy (Nasdaq 100 – QQQ)
A short-term trading strategy that is based on the MACD indicator. Backtested on the ETF that tracks Nasdaq 100 (QQQ).
Published spring 2023.
The strategy has code for Amibroker, Tradestation/Easy Langauge, and TradingView/Pinescript.
Statistics and figures (QQQ – Nasdaq 100) – including commissions and slippage of 0.03% per trade:
- No. of trades: 121
- Average unleveraged gain per trade: 1.3%
- Win ratio: 80%
- Profit factor: 4.5
- Annual returns (CAGR): 6.1% (assuming no leverage)
- Exposure/time in the market: 6%
- Risk-adjusted return: 103% (CAGR divided by time spent in the market (0.16))
- Max. drawdown: -20%
The equity curve (log scale):
Order by clicking here (check for strategy no. 40):
Once you have paid you can download the strategy on this link.
Strategy 41: Bollinger Band Trading Strategy (S&P 500 – SPY)
A short-term trading strategy that is based on Bollinger Bands. Backtested on the ETF that tracks S&P 500 (SPY).
The strategy has code for Amibroker and Tradestation/Easy Langauge.
Published spring 2023.
Statistics and figures (SPY – S&P 500): – including commissions and slippage of 0.03% per trade
- No. of trades: 568
- Average unleveraged gain per trade: 0.4%
- Win ratio: 70%
- Profit factor: 1.7
- CAGR: 6.5% (assuming no leverage)
- Exposure/time in the market: 20%
- Risk-adjusted return: 16% (CAGR divided by time spent in the market (0.2))
- Max. drawdown: -18%
The equity curve (log scale):
Order by clicking here (check for strategy no. 41):
Once you have paid you can download the strategy on this link.
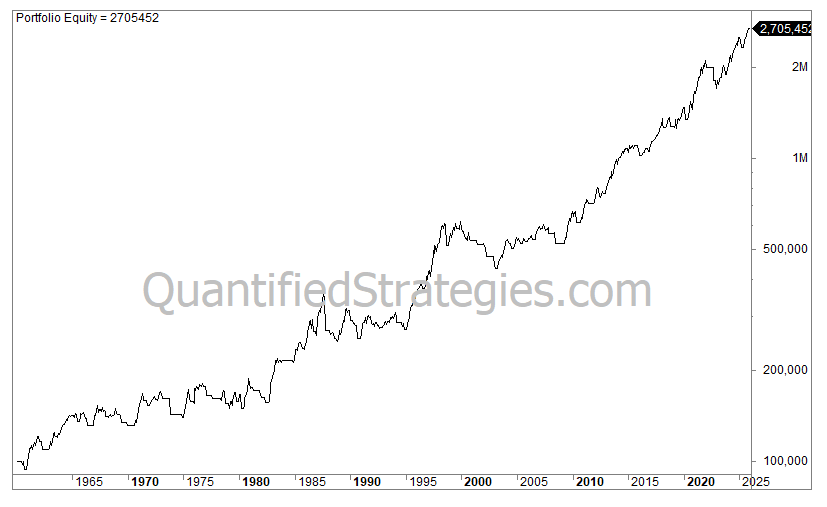
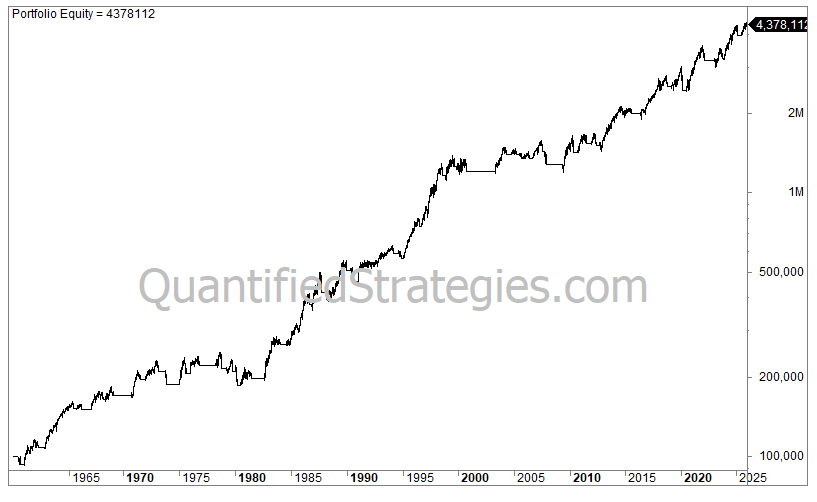
Strategy 42: 3 Trend following Strategies (S&P 500/SPY Bundle)
The three strategies have different trading rules for entry but the same rules for exit. Backtested on the ETF that tracks S&P 500 (SPY).
The strategy has code for Amibroker and Tradestation/Easy Langauge.
Published 2021/2022.
Statistics and figures (S&P 500) – including slippage and commissions of 0.03% per trade:
- No. of trades: 22
- Average unleveraged gain per trade: 31.9%
- Win ratio: 77%
- Profit factor: 6
- CAGR: 7.6% vs 7.2% for Buy&Hold (assuming no leverage and no reinvested dividends – cash index)
- Exposure/time in the market: 81%
- Risk-adjusted return: 9.4% (CAGR divided by time spent in the market (0.81))
- Max. drawdown: -35%
The equity curve when all 3 strategies are traded as a portfolio of strategies (log scale):
Order by clicking here (check for strategy no. 42):
Once you have paid you can download the strategy on this link.
Strategy 43: 3 Swing Trading Strategies (QQQ Bundle)
The strategies trade from the long side. Backtested on the ETF that tracks Nasdaq 100 (QQQ).
The strategy has code for Amibroker and Tradestation/Easy Langauge.
The bundle is not eligible for any of the membership strategy selections.
Published early 2023.
Statistics and figures (QQQ) – including commissions and slippage of 0.03% per trade :
- No. of trades: 492
- Average unleveraged gain per trade: 0.75%
- Win ratio: 71%
- Profit factor: 2.3
- Annual returns (CAGR): 14.3% (assuming no leverage)
- Exposure/time in the market: 29%
- Risk-adjusted return: 49% (CAGR divided by time spent in the market (0.29))
- Max. drawdown: -31%
The equity curve when all three strategies are traded as a portfolio of strategies (log scale):
Annual returns:
Order by clicking here (check for strategy no. 43):
Once you have paid you can download the strategy on this link.
Strategy 44: MACD Indicator Trading Strategy (Nasdaq 100 – QQQ)
The strategy uses the MACD indicator in a rather creative way. The strategy is presented as strategy #3 in our MACD strategy video. Backtested on the ETF that tracks Nasdaq 100 (QQQ).
Published spring 2023 (old strategy first mentioned on this blog in 2015).
The strategy has code for Amibroker, Tradestation/Easy Langauge, and TradingView/Pinescript.
Statistics and figures (Nasdaq- 100 – QQQ) including commissions and slippage of 0.03% per trade:
- No. of trades: 181
- Average unleveraged gain per trade: 1%
- Win ratio: 77%
- Profit factor: 3
- CAGR: 7.2% (assuming no leverage and no dividends)
- Exposure/time in the market: 9%
- Risk-adjusted return: 81% (CAGR divided by time spent in the market (0.09))
- Max. drawdown: -11%
The equity curve (log scale):
Order by clicking here (check for strategy no. 44):
Once you have paid, you can download the strategy on this link.
Strategy 45: Heikin Ashi Trading Strategy (S&P 500 – SPY)
The Heikin Ashi strategy uses monthly bars and is thus a long-term trend-following strategy. Backtested on the ETF that tracks S&P 500 (SPY).
Only available in Amibroker code.
Published spring 2023.
Statistics and figures (S&P 500) – including commissions and slippage of 0.03% per trade:
- No. of trades: 84
- Average unleveraged gain per trade: 4.6%
- Win ratio: 50%
- Profit factor: 3
- CAGR: 5.1% (assuming no leverage and no dividends)
- Exposure/time in the market: 66%
- Risk-adjusted return: 7.5% (CAGR divided by time spent in the market (0.66))
- Max. drawdown: -29%
The equity curve (log scale) – monthly bars:
Order by clicking here (check for strategy no. 45):
Once you have paid, you can download the strategy on this link.
Strategy 46: LL & LH (Lower Lows & Lower Highs) Trading Strategy (Semis – SMH)
A mean reversion strategy. Backtested on the ETF that tracks semiconductors (SMH). Works on QQQ and SPY as well.
The strategy has code for Amibroker and Tradestation/Easy Langauge.
Published spring 2021.
Statistics and figures (Semiconductors – SMH) – including commissions and slippage of 0.03% per trade:
- No. of trades: 236
- Average unleveraged gain per trade: 1%
- Win ratio: 74%
- Profit factor: 2.4
- Annual returns (CAGR): 9.8% (assuming no leverage and no dividends)
- Exposure/time in the market: 13%
- Risk-adjusted return: 73% (CAGR divided by time spent in the market (0.13))
- Max. drawdown: -48%
The equity curve (log scale):
Order by clicking here (check for strategy no. 46):
Once you have paid you can download the strategy on this link.
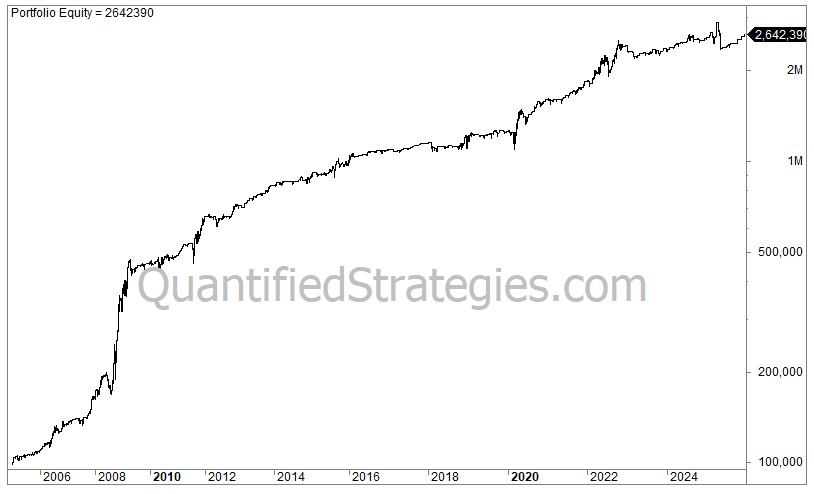
Strategy 47: Combining long and short strategies
Not eligible for any of the membership strategy selections.
This product offers a steep discount for two bundles: Strategy Bundle 1 (long strategies) and Strategy Bundle 3 (short strategies). Below are the performance metrics of combining both bundles for the following backtested assets:
Statistics and figures (S&P 500, (SPY/@ES), Consumer staples (XLP), and Semiconductors (SMH)) – including slippage and commissions if 0.03% per trade:
- No. of trades: 725 (from 2005)
- Average unleveraged gain per trade: 0.53%
- Win ratio: 70%
- Profit factor: 1.8
- Annual returns (CAGR): 16% (assuming no leverage and no dividends)
- Exposure/time in the market: 35%
- Risk-adjusted return: 47% (CAGR divided by time spent in the market (0.35))
- Max. drawdown: -23%
The equity curve (log scale):
Order by clicking here (check for strategy no. 47):
Once you have paid you can download the strategy on this link.
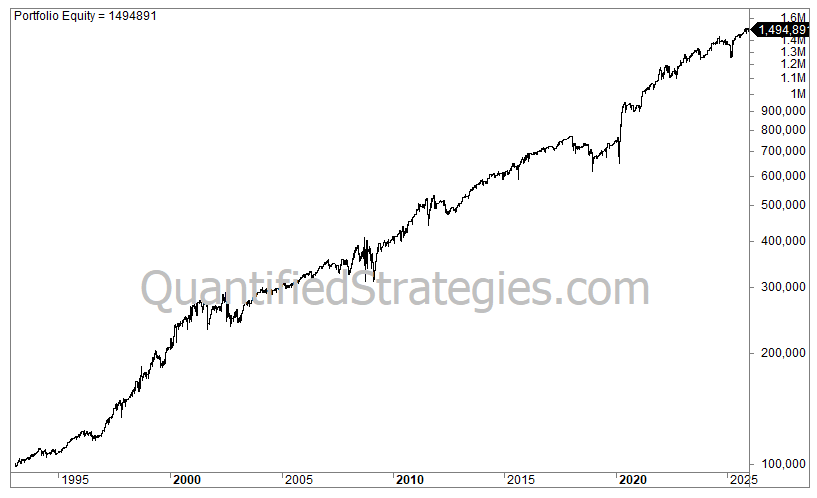
Strategy 48: Bitcoin Trading Strategy (3 Strategies In One Bundle)
The three strategies are diverse: One strategy is a mean reversion strategy, a seasonal trade, and a momentum strategy.
The strategies come with code for Tradestation, TradingView/Pinescript, and Amibroker.
PS! Bitcoin trades around the clock, and thus, settings might influence the results, not to mention commissions, which are hard to predict. Bitcoin has historically suffered VERY deep drawdowns (also this backtest). Very few can stomach that.
Published in 2021 and 2022.
Statistics and figures (All 3 strategies as one portfolio of strategies):
- No. of trades: 163 (from 2015)
- Average unleveraged gain per trade: 5.7%
- Win ratio: 47%
- Profit factor: 2
- Annual returns (CAGR): 100 (assuming no leverage)
- Exposure/time in the market: 60%
- Risk-adjusted return: 168% (CAGR divided by time spent in the market (0.6))
- Max. drawdown: -49% (!!!)
The equity curve (log scale – all 3 strategies as one portfolio of strategies – 10,000 compounded):
Order by clicking here (check for strategy no. 48):
Once you have paid you can download the strategy on this link.
Strategy 49: Buy the dip Trading Strategy (S&P 500 – SPY)
Mean reversion based on bullish long term trends and pullbacks. Backtested on the ETF that tracks S&P 500 (SPY).
The strategy has code for Amibroker and Tradestation/Easy Langauge.
Published spring 2023.
Statistics and figures (S&P 500 – SPY) – including commissions and slippage of 0.03% per trade:
- No. of trades: 284
- Average unleveraged gain per trade: 0.4%
- Win ratio: 71%
- Profit factor: 2.4
- CAGR: 3.4% (assuming no leverage)
- Exposure/time in the market: 9%
- Risk-adjusted return: 34% (CAGR divided by time spent in the market (0.09))
- Max. drawdown: -14%
The equity curve (log scale):
Order by clicking here (check for strategy no. 49):
Once you have paid you can download the strategy on this link.
Strategy 50: Super indicator Trading Strategy (S&P 500 – SPY)
The SuperTrend Indicator is a weekly trend-following strategy (meaning weekly bars).
We have the trading rules in plain English and code for Amibroker (no code for Tradestation/Easy Langauge).
Backtested on the ETF that tracks S&P 500 (SPY).
Published late 2022.
Statistics and figures (S&P 500):
- No. of trades: 39
- Average unleveraged gain per trade: 10.8% (18.4% for winners and -4.2% for losers)
- Win ratio: 66%
- Profit factor: 4
- CAGR: 5.9% (assuming no leverage and no dividends)
- Exposure/time in the market: 62%
- Risk-adjusted return: 9.5% (CAGR divided by time spent in the market (0.62))
- Max. drawdown: -24%
The equity curve (log scale):

Order by clicking here (check for strategy no. 50):
Once you have paid you can download the strategy on this link.
Strategy 51: Money Flow Index Trading Strategy (S&P 500 – SPY)
The money flow index (MFI) is a momentum indicator that measures the flow of money into and out of a security over a specified period of time by combining price and volume data. It oscillates between 0 and 100 and shows overbought and oversold conditions in the market. Backtested on the ETF that tracks S&P 500 (SPY).
The strategy has code for Amibroker and Tradestation/Easy Langauge.
Published spring 2023.
Performance metrics (S&P 500 – SPY) Including slippage and commissions of 0.03% per trade:
- No. of trades: 895
- Average unleveraged gain per trade: 0.3%
- Win ratio: 72%
- Profit factor: 1.7
- Annual returns (CAGR): 7.5% (assuming no leverage and no dividends)
- Exposure/time in the market: 28%
- Risk-adjusted return: 26% (CAGR divided by time spent in the market (0.28))
- Max. drawdown: -23%
The equity curve (log scale):
Order by clicking here (check for strategy no. 51):
Once you have paid you can download the strategy on this link.
Strategy 52: Momentum Trading Strategy (S&P 500 – SPY)
The momentum strategy has flexible rules that make it useful for stocks and crypto. The equity curve below is based on the S&P 500.
The strategy has code for Amibroker and Tradestation/Easy Langauge.
Published autumn 2022.
Performance metrics (S&P 500):
- No. of trades: 43
- Average unleveraged gain per trade: 10.1%
- Win ratio: 67%
- Profit factor: 7
- Annual returns (CAGR): 5.9% (assuming no leverage and no dividends)
- Exposure/time in the market: 65%
- Risk-adjusted return: 9% (CAGR divided by time spent in the market (0.67))
- Max. drawdown: -25%
The equity curve (log scale):
Order by clicking here (check for strategy no. 52):
Once you have paid you can download the strategy on this link.
Strategy 53: Short-Term Pullback Strategy For S&P 500 (SPY)
A strategy that tries to capture a pullback from new highs. Commissions and slippage of 0.03% are included for each trade.
The strategy has code for Amibroker and Tradestation/Easy Langauge.
This was our trading edge for March 2024.
Performance metrics (SPY) – including commissions and slippage of 0.03% per trade:
- No. of trades: 269
- Average unleveraged gain per trade: 0.5%
- Win ratio: 72%
- Profit factor: 2.5
- Annual returns (CAGR): 4.4% (assuming no leverage and no dividends)
- Exposure/time in the market: 11%
- Risk-adjusted return: 37% (CAGR divided by time spent in the market (0.11))
- Max. drawdown: -12%
The equity curve (log scale):
Order by clicking here (check for strategy no. 53):
Once you have paid you can download the strategy on this link.
Strategy 54: 6 Larry Connors Trading Strategies (S&P 500 – SPY)
We compiled 6 Larry Connors strategies into one product for the price of one strategy. We added a variable. Backtested on the ETF that tracks S&P 500 (SPY).
The strategy has code for Amibroker and Tradestation/Easy Langauge.
Published in autumn 2021.
Once you have paid, you can download the 6 strategies on this link.
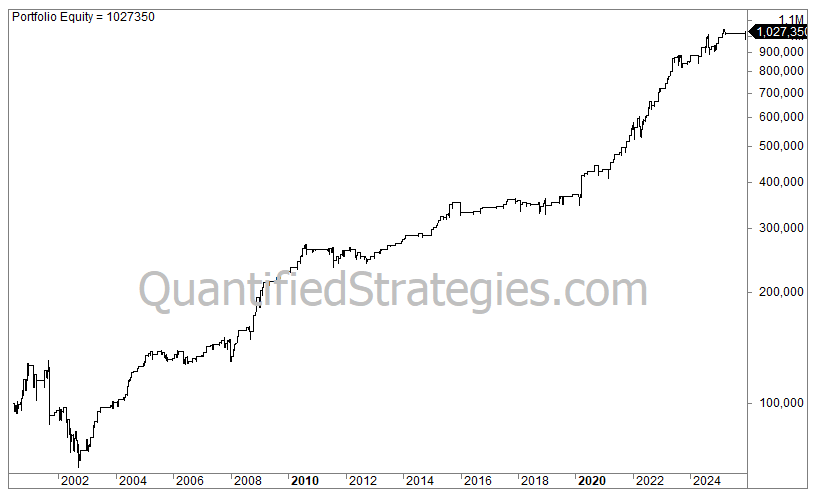
Strategy 55: IBS Trading Strategy (Nasdaq – QQQ)
The strategy is based on the IBS indicator. Backtested on the ETF that tracks Nasdaq 100 (QQQ), but it works on other stock ETFs.
The strategy has code for Amibroker and Tradestation/Easy Langauge.
Published spring 2023 (but previously published in 2016/17).
Performance metrics (Nasdaq – QQQ) – including commissions and slippage of 0.03% per trade:
- No. of trades: 525
- Average unleveraged gain per trade: 0.65%
- Win ratio: 68%
- Profit factor: 2.2
- Annual returns (CAGR): 13.3% (assuming no leverage and no dividends – 3.5% better than Buy & Hold)
- Exposure/time in the market: 26%
- Risk-adjusted return: 50% (CAGR divided by time spent in the market (0.26))
- Max. drawdown: -41% (Buy & Hold 82%)
The equity curve (log scale):
Order by clicking here (check for strategy no. 55):
Once you have paid you can download the strategy on this link.
Strategy 56: Gold (GLD) Seasonal Trend Strategy
The strategy trades GLD on a certain trading day when the trend is strong.
The strategy has code for Amibroker and Tradestation/Easy Langauge.
This was the trading edge for September 2024.
Performance metrics (GLD) – including commissions and slippage of 0.03% per trade:
- No. of trades: 87
- Average unleveraged gain per trade: 0.72% (1.4% for winners – minus 1% for losing trades)
- Win ratio: 72%
- Profit factor: 3
- CAGR: 3.1% (assuming no leverage)
- Exposure/time in the market: 4.1%
- Risk-adjusted return: 76% (CAGR divided by time spent in the market (0.04))
- Max. drawdown: -6%
The equity curve (log scale):
Order by clicking here (check for strategy no. 56):
Once you have paid you can download the strategy on this link.
Strategy 57: Coppock Trading Strategy (S&P 500/SPY)
The Coppock Curve was developed in the 1950s and is a trend-following strategy. It has historically worked for stocks and the gold price. Backtested on the ETF that tracks S&P 500 (SPY).
Only available in Amibroker code.
Published early 2023.
Performance metrics (S&P 500):
- No. of trades: 13
- Average unleveraged gain per trade: 44%
- Win ratio: 100%
- Profit factor: NA
- CAGR: 6.4% (assuming no leverage and no dividends – slightly below Buy & Hold)
- Exposure/time in the market: 73%
- Risk-adjusted return: 8.6% (CAGR divided by time spent in the market (0.73))
- Max. drawdown: -30% (Buy & Hold 55%)
The equity curve (log scale):
Order by clicking here (check for strategy no. 57):
Once you have paid you can download the strategy on this link.
Strategy 58: 200-Day Moving Average Trading Strategy (S&P 500/SPY)
We made a small twist to the 200-day moving average strategy. Backtested on the ETF that tracks S&P 500 (SPY).
The strategy has code for Amibroker and Tradestation/Easy Langauge.
Published spring 2023.
Performance metrics (S&P 500) – including slippage and commissions of 0.03% per trade:
- No. of trades: 81
- Average unleveraged gain per trade: 6.4%
- Win ratio: 50%
- Profit factor: 2.9
- Annual returns (CAGR): 6.9% (assuming no leverage and no dividends – same return as Buy & Hold)
- Exposure/time in the market: 70%
- Risk-adjusted return: 9.9% (CAGR divided by time spent in the market (0.7))
- Max. drawdown: -22% (Buy & Hold 55%)
The equity curve (log scale):
Order by clicking here (check for strategy no. 58):
Once you have paid you can download the strategy on this link.
Strategy 59: Triple RSI Trading Strategy (S&P 500 – SPY)
The strategy uses three different RSI variables plus a trend filter. Backtested on the ETF that tracks S&P 500 (SPY).
The strategy has code for Amibroker and Tradestation/Easy Langauge.
Published spring 2023.
Performance metrics (SPY – S&P 500) – including slippage and commissions of 0.03% per trade:
- No. of trades: 97
- Average unleveraged gain per trade: 1.2%
- Win ratio: 90%
- Profit factor: 8
- Annual returns (CAGR): 3.8% (assuming no leverage)
- Exposure/time in the market: 5%
- Risk-adjusted return: 69% (CAGR divided by time spent in the market (0.05))
- Max. drawdown: -13%
The equity curve (log scale):
Order by clicking here (check for strategy no. 59):
Once you have paid you can download the strategy on this link.
Strategy 60: Nasdaq Interest Rate Strategy (QQQ)
The strategy is based on interest rate levels. The strategy trades at the open the day after the signal.
The strategy has code for Amibroker and Tradestation/Easy Langauge.
This was our monthly trading edge for August 2024.
Performance metrics:
- No. of trades: 264
- Average unleveraged gain per trade: 0.76%
- Win ratio: 73%
- Profit factor: 2.5
- Annual returns (CAGR): 8.8% (assuming no leverage)
- Exposure/time in the market: 16%
- Risk-adjusted return: 55% (CAGR divided by time spent in the market (0.16))
- Max. drawdown: -19%
The equity curve (log scale):
Order by clicking here (check for strategy no. 60):
Once you have paid you can download the strategy on this link.
Strategy 61: Rubber band Trading Strategy (Nasdaq 100 – QQQ)
Based on fast and volatile markets. Backtested on the ETF that tracks Nasdaq 100 (QQQ).
The strategy has code for Amibroker and Tradestation/Easy Langauge.
Published first time in 2016/2017.
Performance metrics (Nasdaq 100 – QQQ) – including commissions and slippage of 0.03% per trade:
- No. of trades: 277
- Average unleveraged gain per trade: 1.05%
- Win ratio: 70%
- Profit factor: 2.2
- Annual returns (CAGR): 11.2% (assuming no leverage)
- Exposure/time in the market: 16%
- Risk-adjusted return: 68% (CAGR divided by time spent in the market (0.16))
- Max. drawdown: -23%
The equity curve (log scale):
Order by clicking here (check for strategy no. 61):
Once you have paid you can download the strategy on this link.
Strategy 62: Gold Weekly Momentum Strategy (GLD)
The strategy utilizes weekly bars and operates exclusively from the long side.
The strategy has code for Amibroker and Tradestation/Easy Langauge.
The strategy was our monthly trading edge for October 2025.
Performance metrics (GLD – slippage and commission of 0.03% per trade is included):
- No. of trades: 144
- Average unleveraged gain per trade: 1%
- Win ratio: 80%
- Profit factor: 2.3
- CAGR: 6.9%
- Exposure/time in the market: 35%
- Risk-adjusted return: 20% (CAGR divided by time spent in the market (0.35))
- Max. drawdown: -24%
The equity curve (log scale):
Order by clicking here (check for strategy no. 62):
Once you have paid you can download the strategy on this link.
Strategy 63: Chopiness Strategy for S&P 500/Nasdaq 100
The strategy is partially based on the Choppiness Index, which determines whether the market is choppy or trending.
The strategy is available for Amibroker, Tradestation, and TradingVirew/Pinescript code. A reader provides the latter (Pinescript), so we are not responsible for the code.
(Previously, we had a momentum strategy for stocks, gold, and bonds as #63, but it has not performed well for 8 years.)
This was our monthly trading edge for June 2024.
Performance metrics: – including commissions and slippage of 0.03% per trade (QQQ):
- No. of trades: 154
- Average unleveraged gain per trade: 1.1%
- Win ratio: 80%
- Profit factor: 2.3
- Annual returns (CAGR): 6.1% (assuming no leverage)
- Exposure/time in the market: 6%
- Risk-adjusted return: 96% (CAGR divided by time spent in the market (0.06))
- Max. drawdown: -17%
The equity curve (log scale):
Order by clicking here (check for strategy no. 63):
Once you have paid you can download the strategy on this link.
Strategy 64: Monthly momentum strategy in gold, bonds, and stocks
The strategy rotates between three assets (SPY, GLD, and TLT). However, our experience is that rotation strategies frequently break apart.
The strategy has code for Amibroker only.
Published spring 2018.
Performance metrics:
- No. of trades: 476
- Average unleveraged gain per trade: 0.8%
- Win ratio: 56%
- Profit factor: 1.4
- CAGR: 8.6% (assuming no leverage)
- Exposure/time in the market: 90%
- Risk-adjusted return: 9.5 (CAGR divided by time spent in the market (0.9))
- Max. drawdown: -19%
The equity curve (log scale):
Order by clicking here (check for strategy no. 64):
Once you have paid you can download the strategy on this link
Strategy 65: Last Trading Day Of The Month Trading Strategy S&P 500 (SPY)
The strategy uses a seasonal effect in stocks and enters on the last day of the month. Backtested on the ETF that tracks S&P 500 (SPY).
The strategy has code for Amibroker and Tradestation/Easy Langauge.
This was the monthly trading edge for September 2023.
Performance metrics (S&P 500 – SPY) – including commissions and slippage of 0.03% per trade:
- No. of trades: 197
- Average unleveraged gain per trade: 0.54%
- Win ratio: 78%
- Profit factor: 2.5
- Annual returns (CAGR): 3.4% (assuming no leverage)
- Exposure/time in the market: 6%
- Risk-adjusted return: 59% (CAGR divided by time spent in the market (0.06))
- Max. drawdown: -13%
The equity curve (log scale):
Order by clicking here (check for strategy no. 65):
Once you have paid you can download the strategy on this link.
Strategy 66: Russell 2000 rebalancing strategy (IWM)
The strategy trades the Russell 2000 index (futures or ETF (IWM)), an annual seasonal trade.
The strategy has code for Amibroker and Tradestation/Easy Langauge.
Published summer 2021.
Performance metrics (^RUT – Russell 2000) – including commissions and slippage of 0.03% per trade:
- No. of trades: 25
- Average unleveraged gain per trade: 1.4%
- Win ratio: 68%
- Profit factor: 3
- Annual returns (CAGR): 1.4% (assuming no leverage)
- Exposure/time in the market: 2%
- Risk-adjusted return: 69% (CAGR divided by time spent in the market (0.02))
- Max. drawdown: -6%
The equity curve (log scale):

Order by clicking here (check for strategy no. 66):
Once you have paid you can download the strategy on this link
Strategy 67: ADX Trading Strategy (Nasdaq 100 – QQQ)
The ADX is a trend indicator that usually needs a helping variable. We made an ADX strategy with another variable. Backtested on the ETF that tracks Nasdaq 100 (QQQ).
The strategy has code for Amibroker and Tradestation/Easy Langauge.
Published spring 2023.
Performance metrics (QQQ – Nasdaq 100) – including slippage and commissions of 0.03% per trade:
- No. of trades: 340
- Average unleveraged gain per trade: 0.85%
- Win ratio: 78%
- Profit factor: 2.2
- CAGR: 11.3% (assuming no leverage)
- Exposure/time in the market: 17%
- Risk-adjusted return: 65% (CAGR divided by time spent in the market (0.17))
- Max. drawdown: -21%
The equity curve (log scale):
Order by clicking here (check for strategy no. 67):
Once you have paid you can download the strategy on this link
Strategy 68: Candlesticks Trading Strategies (Bundle -S&P 500 – SPY)
We have made a candlestick course available for both Amibroker and Tradestation/Easy Language users. Backtested on the ETF that tracks S&P 500 (SPY).
- 100% quantified, data-driven, and backtested with specific trading rules;
- Choose the best pattern with our ranking methods based on past performance;
- All patterns have Amibroker or Tradestation/Easy Language code.
Please click on the image below to read more or order:

Strategy 69: Monthly (Or Weekly) Sector Rotation Trading Strategy
This is a sector rotation strategy in the S&P 500 (SPY), international stocks, etc. USA (EFA), gold (GLD), and bonds (TLT). It trades weekly or monthly (Fridays or the end of the month). Trading rules are in plain English and Amibroker.
The strategy has code for Amibroker and Tradestation.
This was our monthly trading edge for November 2025.
Performance metrics (monthly):
- No. of trades: 187
- Average unleveraged gain per trade: 1.4%
- Win ratio: 60%
- Profit factor: 2
- CAGR: 12.5% (assuming no leverage and not including dividends)
- Exposure/time in the market: 100%
- Max. drawdown: -21%
The equity curve (log scale monthly):
Order by clicking here (check for strategy no. 69):
Once you have paid, you can download the strategy on this link.
Strategy 70: Bollinger Bands + RSI Trading Strategy (SMH – semiconductors)
The strategy below trades BOTH long and short. Backtested on the ETF that tracks Semiconductors (SMH).
The strategy has code for Amibroker and Tradestation/Easy Langauge.
Published spring 2023.
Performance metrics (Semiconductors (SMH) – including commissions and slippage of 0.03% per trade:
- No. of trades: 297
- Average unleveraged gain per trade: 0.65%
- Win ratio: 67%
- Profit factor: 1.9%
- CAGR: 8.3% (assuming no leverage and not including dividends)
- Exposure/time in the market: 16%
- Risk-adjusted return: 51% (CAGR divided by time spent in the market (0.16))
- Max. drawdown: -13%
The equity curve (log scale):
Order by clicking here (check for strategy no. 70):
Once you have paid you can download the strategy on this link
Strategy 71: MACD + RSI Trading Strategy (SMH – semis)
We combined both indicators to make a swing strategy that lasted a few days. Backtested on the ETF that tracks semiconductors (SMH).
The strategy has code for Amibroker and Tradestation/Easy Langauge.
Published spring 2023.
The strategy performs better with a trend filter (not included in the rules) and drawdowns are dramatically reduced.
Performance metrics (Consumer staples- SMH) – including commissions and slippage of 0.03%:
- No. of trades: 235
- Average unleveraged gain per trade: 0.9%
- Win ratio: 73%
- Profit factor: 2.3
- Annual returns (CAGR): 8% (assuming no leverage but including dividends)
- Exposure/time in the market: 14%
- Risk-adjusted return: 56% (CAGR divided by time spent in the market (0.14))
- Max. drawdown: -46%
The equity curve (log scale):
Order by clicking here (check for strategy no. 71):
Once you have paid you can download the strategy on this link
Strategy 72: ADX + RSI Trading Strategy (Nasdaq 100 – QQQ)
Backtested on the ETF that tracks Nasdaq 100 (QQQ).
The strategy has code for Amibroker and Tradestation/Easy Langauge.
Published spring 2023.
Performance metrics (Nasdaq 100 – QQQ) – including commissions and slippage of 0.03% per trade:
- No. of trades: 258
- Average unleveraged gain per trade: 1%
- Win ratio: 73%
- Profit factor: 2.4%
- Annual returns (CAGR): 10.5% (assuming no leverage and not including dividends)
- Exposure/time in the market: 15%
- Risk-adjusted return: 70% (CAGR divided by time spent in the market (0.15))
- Max. drawdown: -23%
The equity curve (log scale):
Order by clicking here (check for strategy no. 72):
Once you have paid you can download the strategy on this link
Strategy 73: Day Trading Strategy (Short) For S&P 500 (SPY)
Trading rules in plain English and code for Amibroker and Tradestation/Multicharts. It’s based on a seasonal pattern and uses one external indicator.
The strategy goes short at the open and covers at the close.
Backtested on the ETF that tracks Nasdaq 100 (QQQ).
This was our monthly trading edge for October 2024.
Performance metrics (S&P 500 – SPY):
- No. of trades: 109
- Average unleveraged gain per trade: 0.28% (0.65% for winners and -0.52% for losers)
- Win ratio: 69%
- Profit factor: 2.5
- CAGR: 1.3% (assuming no leverage but including dividends)
- Exposure/time in the market: 2%
- Risk-adjusted return:671% (CAGR divided by time spent in the market (0.01))
- Max. drawdown: -3%
The equity curve (log scale):
Order by clicking here (check for strategy no. 73):
Once you have paid you can download the strategy on this link.
Strategy 74: Long Panic Strategy For Bonds (TLT)
The strategy does not trade often, but only when it’s “panic” and aims for a very short holding period.
The strategy was our monthly trading edge for April 2025.
Performance metrics (TLT) – including slippage and commissions of 0.03% per trade:
- No. of trades: 85
- Average unleveraged gain per trade: 0.35%
- Win ratio: 76%
- Profit factor: 3
- Annual returns (CAGR): 1.3% (assuming no leverage but including dividends)
- Exposure/time in the market: 2.5%
- Risk-adjusted return: 52% (CAGR divided by time spent in the market (0.025))
- Max. drawdown: -2.7%
The equity curve (log scale):
Order by clicking here (check for strategy no. 74):
Once you have paid you can download the strategy on this link.
Strategy 75: 3 VIX Trading Strategies (Bundle – Nasdaq 100 – QQQ)
Trading rules in plain English and code for Amibroker and Tradestation/Multicharts. Not eligible for any of the membership strategy selections. The bundle uses the VIX indicator to trade stocks (bonds with some modifications). Backtested on the ETF that tracks Nasdaq 100 (QQQ).
Published summer 2023.
Performance metrics (Nasdaq 100 – QQQ – as one portfolio of strategies) – including slippage and commissions of 0.03% per trade:
- No. of trades: 506
- Average unleveraged gain per trade: 0.7%
- Win ratio: 73%
- Profit factor: 1.8
- Annual returns (CAGR): 13.4% (assuming no leverage but including dividends)
- Exposure/time in the market: 30%
- Risk-adjusted return: 45% (CAGR divided by time spent in the market (0.3))
- Max. drawdown: -23%
The equity curve (log scale):
Order by clicking here (check for strategy no. 75):
Once you have paid you can download the strategy on this link.
Strategy 76: DMI Trading Strategies (S&P 500 – SPY)
The DMI is part of the ADX indicator. The strategy combines DMI with a trend and mean reversion filter. Backtested on the ETF that tracks S&P 500 (SPY).
The strategy has code for Amibroker and Tradestation/Easy Langauge.
Published spring 2023.
Performance metrics (S&P 500 – SPY) – including commissions and slippage of 0.03% per trade:
- No. of trades: 400
- Average unleveraged gain per trade: 0.35%
- Win ratio: 74%
- Profit factor: 2
- Annual returns (CAGR): 5.7% (assuming no leverage but including dividends)
- Exposure/time in the market: 12%
- Risk-adjusted return: 34% (CAGR divided by time spent in the market (0.12))
- Max. drawdown: -17%
The equity curve (log scale):
Order by clicking here (check for strategy no. 76):
Once you have paid you can download the strategy on this link.
Strategy 77: Bear Market Day Trading Strategy
The strategy trades only during bear market and from the long side.
The strategy has code for Amibroker and Tradestation/Easy Langauge.
The strategy was our monthly trading edge for September 2025.
Performance metrics (SPY – slippage and commission of 0.03% per trade is included):
- No. of trades: 100
- Average unleveraged gain per trade: 0.5%
- Win ratio: 62%
- Profit factor: 2
- CAGR: 1.5%
- Exposure/time in the market: 1%
- Risk-adjusted return: 126% (CAGR divided by time spent in the market (0.1))
- Max. drawdown: -5%
The equity curve (log scale):
Order by clicking here (check for strategy no. 77):
Once you have paid you can download the strategy on this link
Strategy 78: Day Trading Strategy S&P 500 (SPY)
The strategy is backtested on stocks and related indices, futures, and ETFs. Backtested on the ETF that tracks S&P 500 (SPY).
The strategy has code for Amibroker and Tradestation/Easy Langauge.
Published spring 2023.
Performance metrics (S&P 500 – SPY) – including commissions and slippage of 0.03% per trade:
- No. of trades: 166
- Average unleveraged gain per trade: 0.45%
- Win ratio: 60%
- Profit factor: 1.9
- Annual returns (CAGR): 2.3% (assuming no leverage but including dividends)
- Exposure/time in the market: 2%
- Risk-adjusted return: 110% (CAGR divided by time spent in the market (0.02))
- Max. drawdown: -9%
The equity curve (log scale):
Order by clicking here (check for strategy no. 78):
Once you have paid you can download the strategy on this link.
Strategy 79: Short Strategy For Russell 2000 (IWM)
Backtested on the ETF that tracks Russell 2000 (IWM). The strategy is a short strategy.
The strategy has code for Amibroker and Tradestation/Easy Langauge.
We previously had the Qstick Indicator strategy here but removed it due to little interest.
This was our monthly trading edge for April 2024.
Performance metrics (Russell 2000 – IWM) – including commissions and slippage of 0.03% per trade:
- No. of trades: 167
- Average unleveraged gain per trade: 0.6%
- Win ratio: 65%
- Profit factor: 2.3
- Annual returns (CAGR): 3.9% (assuming no leverage but including dividends)
- Exposure/time in the market: 4%
- Risk-adjusted return: 86% (CAGR divided by time spent in the market (0.02))
- Max. drawdown: -11%
The equity curve (log scale):
Order by clicking here (check for strategy no. 79):
Once you have paid you can download the strategy on this link
Strategy 80: End-of-Month Strategy S&P 500 (SPY)
The backtest is based on the statistical end-of-month bias in the stock market. Backtested on the ETF that tracks S&P 500 (SPY).
The strategy has code for Amibroker and Tradestation/Easy Langauge.
This was our Monthy Trading Edge for June 2023 (for Gold Members).
Performance metrics (SPY) – including commissions and slippage of 0.03% per trade:
- No. of trades: 641
- Average unleveraged gain per trade: 0.35%
- Win ratio: 72%
- Profit factor: 2
- Annual returns (CAGR): 6.4%
- Exposure/time in the market: 21%
- Risk-adjusted return: 30% (CAGR divided by time spent in the market (0.21))
- Max. drawdown: -16%
The equity curve (log scale):
Order by clicking here (check for strategy no. 80):
Once you have paid you can download the strategy on this link.
Strategy 81: Turnaround Tuesday Strategy (S&P 500 – SPY)
The backtest is based on The Turnaround Tuesday bias. Backtested on the ETF that tracks S&P 500 (SPY).
Published 2016/17.
Performance metrics (SPY) – including commissions and slippage of 0.03%:
- No. of trades: 400
- Average unleveraged gain per trade: 0.65%
- Win ratio: 75%
- Profit factor: 2.7
- Annual returns (CAGR): 7.9% (assuming no leverage and not including dividends)
- Exposure/time in the market: 12%
- Risk-adjusted return: 63% (CAGR divided by time spent in the market (0.12))
- Max. drawdown: -18%
The equity curve (log scale):
Order by clicking here (check for strategy no. 81):
Once you have paid you can download the strategy on this link
Strategy 82: Turn of the Month Strategy (S&P 500 – SPY)
The backtest is based on the turn-of-the-month bias. Backtested on the ETF that tracks S&P 500 (SPY).
This strategy was our monthly Trading Edge for September 2023 (but published first in 2016/17).
Performance metrics (S&P 500 cash index since 1960) – including commissions and slippage of 0.03% per trade:
- No. of trades: 650
- Average unleveraged gain per trade: 0.65%
- Win ratio: 62%
- Profit factor: 2
- Annual returns (CAGR): 6.3% (assuming no leverage and not including dividends)
- Exposure/time in the market: 24%
- Risk-adjusted return: 26% (CAGR divided by time spent in the market (0.24))
- Max. drawdown: -28%
The equity curve (log scale):
Order by clicking here (check for strategy no. 82):
Once you have paid you can download the strategy on this link
Strategy 83: Ultimate Oscillator Strategy (SMH)
We backtested it in most settings for stocks (S&P 500) and bonds (TLT).
Published spring 2023.
Performance metrics (for SMH – an ETF that tracks semiconductors) – including commissions and slippage of 0.03% per trade:
- No. of trades: 311
- Average unleveraged gain per trade: 0.85%
- Win ratio: 70%
- Profit factor: 2.2
- CAGR: 10.4% (assuming no leverage and not including dividends)
- Exposure/time in the market: 20%
- Risk-adjusted return: 50% (CAGR divided by time spent in the market (0.2))
- Max. drawdown: -46% (!)
The equity curve (log scale):
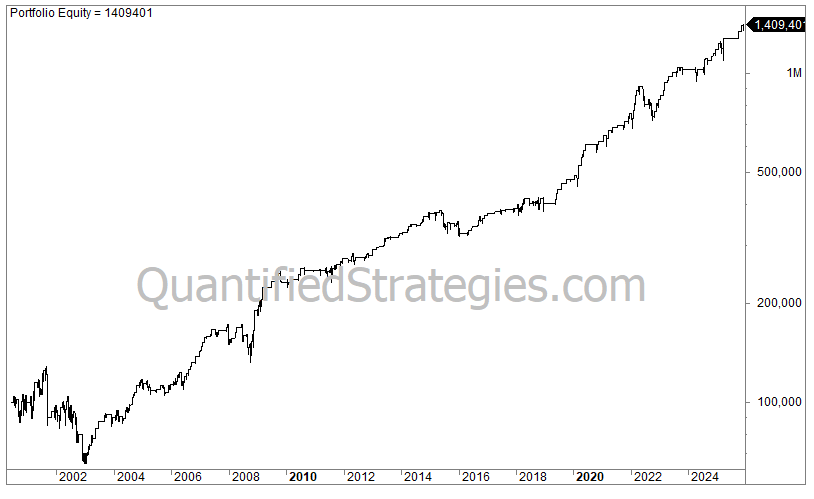
Order by clicking here (check for strategy no. 83):
Once you have paid you can download the strategy on this link
Strategy 84: Double Seven Trading Strategy (S&P 500 – SPY)
Larry Connors’ Double Seven Strategy inspires the strategy, but we have changed the parameters. Backtested on the ETF that tracks S&P 500 (SPY).
Published spring 2023.
Performance metrics (for S&P 500 – SPY) – including commissions and slippage of 0.03% per trade:
- No. of trades: 370
- Average unleveraged gain per trade: 0.6%
- Win ratio: 77%
- Profit factor: 2.2
- Annual returns (CAGR): 6.8% (assuming no leverage and including dividends)
- Exposure/time in the market: 28%
- Risk-adjusted return: 24% (CAGR divided by time spent in the market (0.28))
- Max. drawdown: -14%
The equity curve (log scale):
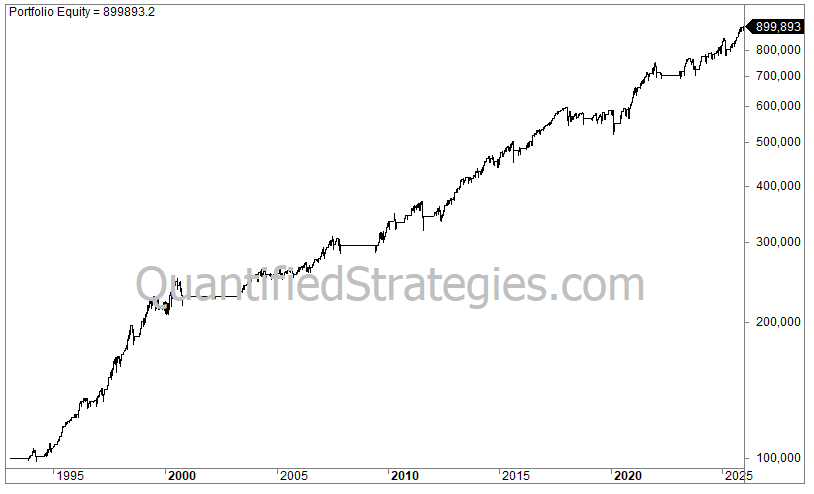
Order by clicking here (check for strategy no. 84):
Once you have paid you can download the strategy on this link.
Strategy 85: Overnight Strategy for Russell 2000 (IWM)
The strategy enters at the close and sells at the open the next day, thus holding for less than 24 hours.
The strategy comes with code for Amibroker, Tradestation/EasyLanguage, and plain rules in English.
This was Trading Edge for February 2024.
Performance metrics (Russell 2000 – IWM) – including commissions and slippage of 0.03% per trade:
- No. of trades: 152
- Average unleveraged gain per trade: 0.31%
- Win ratio: 77%
- Profit factor: 4
- Annual returns (CAGR): 2% (assuming no leverage and including dividends)
- Exposure/time in the market: 2.5%
- Risk-adjusted return: 79% (CAGR divided by time spent in the market (0.025))
- Max. drawdown: -2%
The equity curve since inception (log scale):
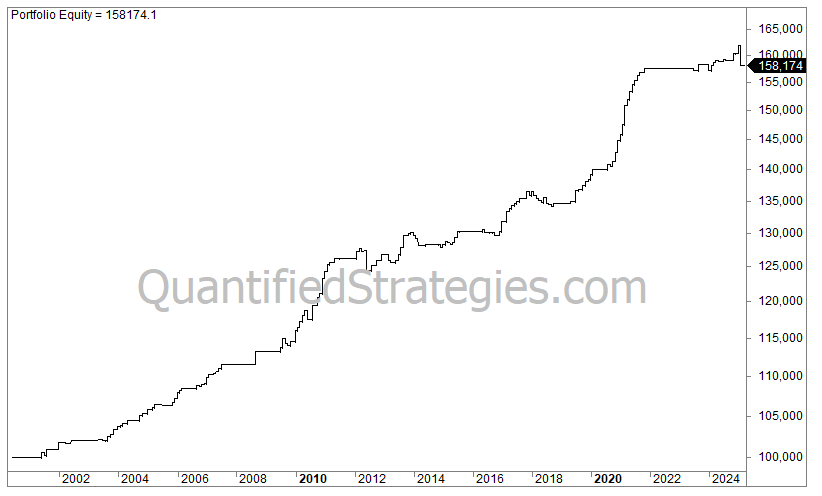
Order by clicking here (check for strategy no. 85):
Once you have paid you can download the strategy on this link.
Strategy 86: Overnight Strategy for Gasoline (UGA)
Trading rules in plain English and code for Amibroker and Tradestation/Multicharts. It’s based on a seasonal pattern and uses two external indicators.
The strategy goes long at the close and sells at the close the next trading day.
Backtested on the ETF that tracks gasoline (UGA). It might work for the liquid corresponding futures contract and other relevant contracts.
This was our monthly trading edge for November 2024.
Performance metrics (Gasoline- UGA):
- No. of trades: 123
- Average unleveraged gain per trade: 0.6% (1.7% for winners and -1.3% for losers)
- Win ratio: 62%
- Profit factor: 2.2
- CAGR: 4.3% (assuming no leverage but including dividends)
- Exposure/time in the market: 2.5%
- Risk-adjusted return: 177% (CAGR divided by time spent in the market (0.01))
- Max. drawdown: -7%
The equity curve (log scale):
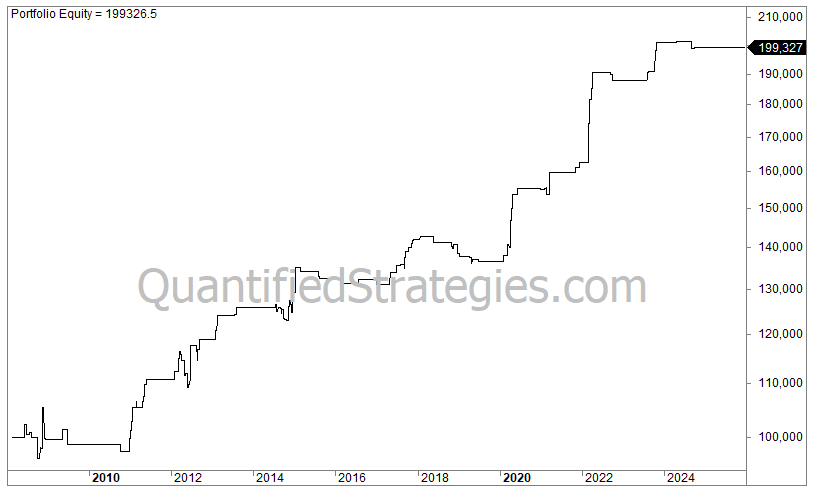
Order by clicking here (check for strategy no. 86):
Once you have paid you can download the strategy on this link.
Strategy 87: Of Combining A Trend Following And Mean Reversion Strategy (Nasdaq 100 – QQQ)
The only Holy Grail in trading is to trade strategies that complement each other. One way is trading two different types of strategies; in this example, we use trend following and mean reversion. Backtested on the ETF that tracks Nasdaq 100 (QQQ).
Published spring 2023.
Performance metrics (for Nasdaq 100 – QQQ) – including commissions and slippage of 0.03% per trade:
- No. of trades: 99
- Average unleveraged gain per trade: 4.4%
- Win ratio: 66%
- Profit factor: 3
- Annual returns (CAGR): 15% (assuming no leverage and including dividends)
- Exposure/time in the market: 72%
- Risk-adjusted return: 21% (CAGR divided by time spent in the market (0.72))
- Max. drawdown: -32%
The equity curve (log scale):
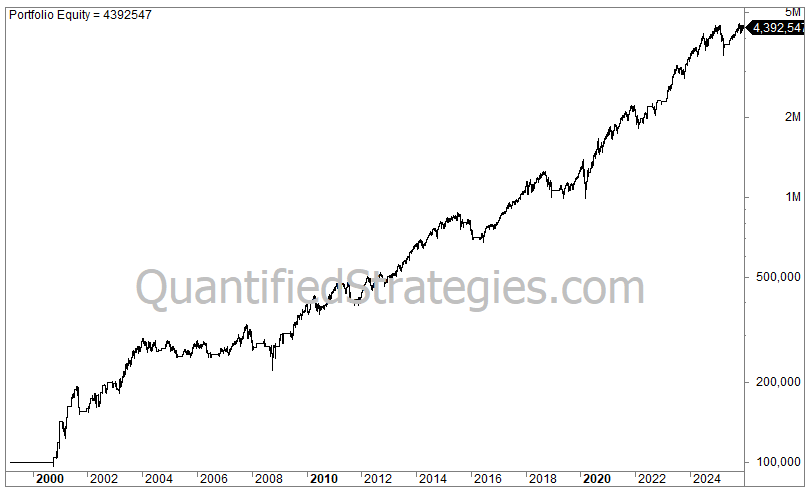
Order by clicking here (check for strategy no. 87):
Once you have paid you can download the strategy on this link.
Strategy 88: Combining Seasonal Effects In S&P 500 and Bonds
The only Holy Grail in trading is to trade strategies that complement each other. This example combines two seasonal effects in bonds and stocks that have existed for decades and that we covered many years ago.
Published spring 2023.
Performance metrics (for SPY and TLT) – including commissions and slippage of 0.03% per trade:
- No. of trades: 467
- Average unleveraged gain per trade: 0.5%
- Win ratio: 63%
- Profit factor: 1.7
- Annual returns (CAGR): 5.5% (assuming no leverage and including dividends)
- Exposure/time in the market/employed capital: 22%
- Risk-adjusted return: 24% (CAGR divided by time spent in the market (0.22))
- Max. drawdown: -7%
The equity curve (log scale):
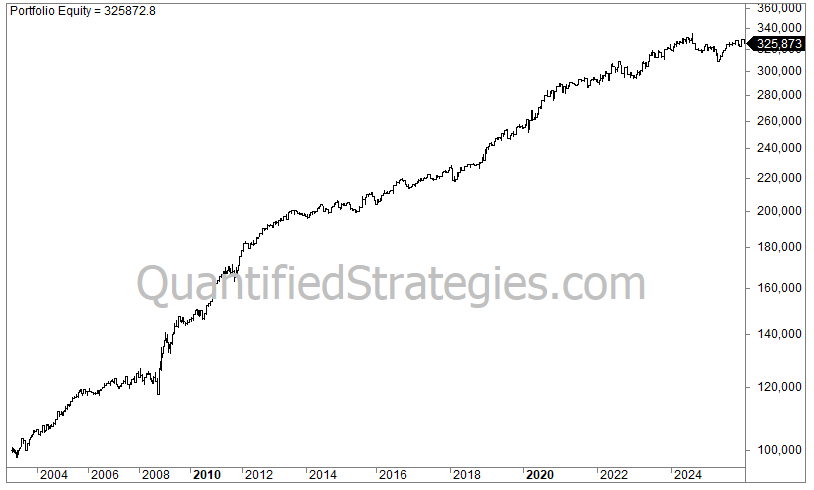
Order by clicking here (check for strategy no. 88):
Once you have paid you can download the strategy on this link.
Strategy 89: First Trading Day Of The Month Trading Strategy for S&P 500 (SPY)
The strategy takes advantage of a historical and statistically strong seasonal effect/anomaly in the stock market: the first trading day of the month. Backtested on the ETF that tracks S&P 500 (SPY).
Published spring 2023.
Performance metrics (S&P 500 – SPY) – including slippage and commissions of 0.03% per trade:
- No. of trades: 76
- Average unleveraged gain per trade: 0.7%
- Win ratio: 76%
- Profit factor: 3
- Annual returns (CAGR): 1.7% (assuming no leverage and including dividends)
- Exposure/time in the market: 2.4%
- Risk-adjusted return: 68% (CAGR divided by time spent in the market (0.024))
- Max. drawdown: -6%
The equity curve (log scale):
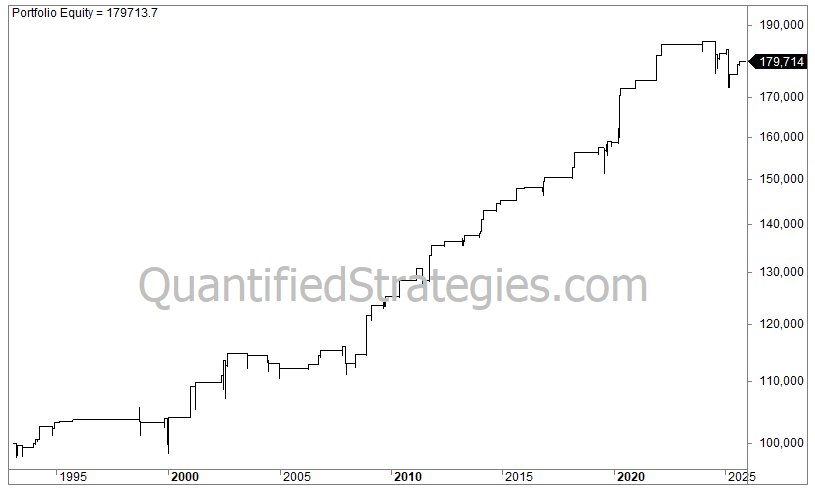
Order by clicking here (check for strategy no. 89):
Once you have paid you can download the strategy on this link.
Strategy 90: Combining A Trend Following And Mean Reversion Strategy for S&P 500 and Nasdaq 100 (QQQ)
We mix an example of a long-term trend-following strategy with a short-term mean reversion strategy. The strategy trades at the close (but the result is slightly better if entries and exits are at the next open). Backtested on the ETF that tracks S&P 500 (SPY) and QQQ. The equity curve is better for SPY than for QQQ.
Published spring 2023.
Performance metrics (Nasdaq 100 – QQQ) – including commissions and slippage of 0.03% per trade:
- No. of trades: 237
- Average unleveraged gain per trade: 1.8%
- Win ratio: 51%
- Profit factor: 3.2
- Annual returns (CAGR): 14% (assuming no leverage and including dividends)
- Exposure/time in the market: 79%
- Risk-adjusted return: 17% (CAGR divided by time spent in the market (0.79))
- Max. drawdown: -50% (-21% for SPY)
The equity curve (log scale):
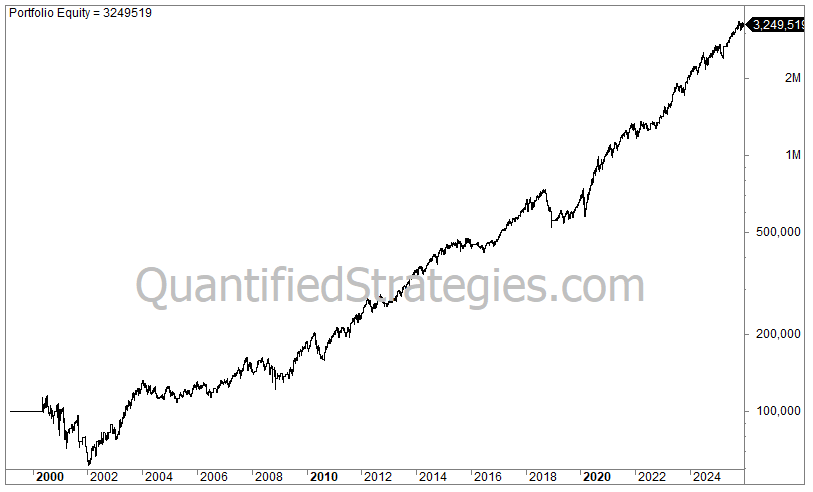
Order by clicking here (check for strategy no. 90):
Once you have paid you can download the strategy on this link.
Strategy 91: Day Of Week Effect On Stocks (Nasdaq 100 – QQQ)
We mix price action and a day-of-week effect to create an example of a potential short-term trading strategy. Backtested on the ETF that tracks Nasdaq 100 (QQQ).
Published spring 2023.
Performance metrics (Nasdaq 100 – QQQ) – including commissions and slippage of 0.03% per trade:
- No. of trades: 458
- Average unleveraged gain per trade: 0.85%
- Win ratio: 76%
- Profit factor: 2.7
- CAGR: 15% (assuming no leverage and including dividends)
- Exposure/time in the market: 25%
- Risk-adjusted return: 58% (CAGR divided by time spent in the market (0.25))
- Max. drawdown: -27%
The equity curve (log scale):
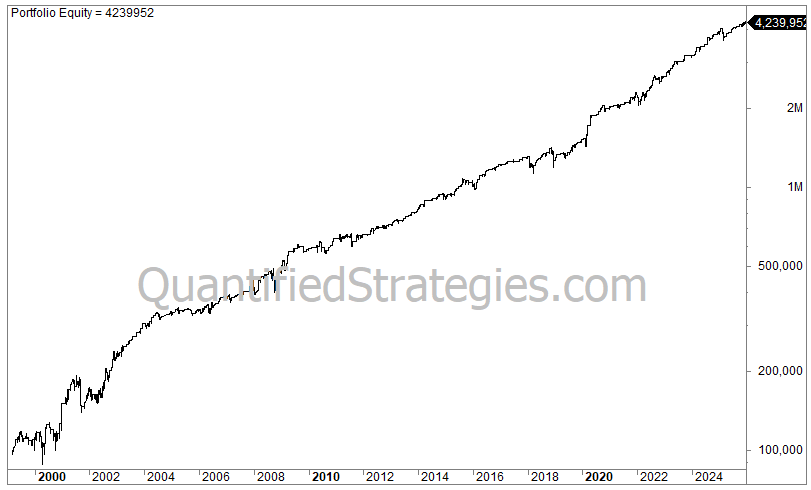
Order by clicking here (check for strategy no. 91):
Once you have paid you can download the strategy on this link.
Strategy 92: Short (Tail Risk) Trading Strategy for QQQ
This short strategy trades infrequently but has historically performed well for volatile stock indices when volatility is high, but is bleeding during bull markets. Shorting is difficult! We offer the strategy in Amibroker, Tradestation/Easy Language, and TradingView/Pinescript code. Backtested on the ETF that tracks NASDAQ 100 (QQQ).
This was our Monthly Trading Edge for July 2023 (for Gold Members).
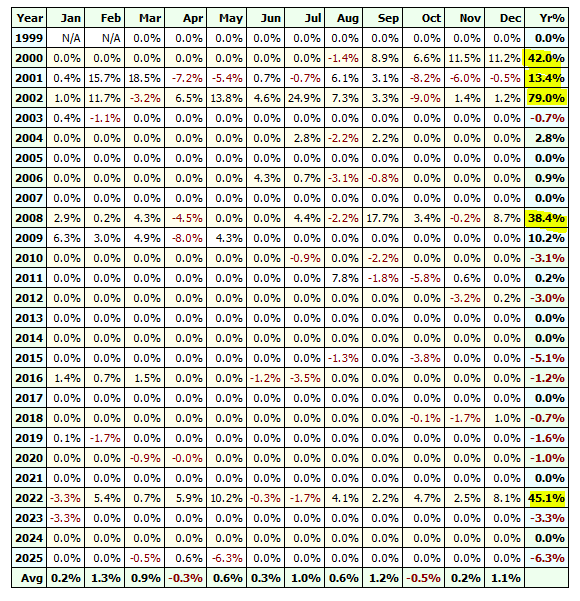
Performance metrics (Nasdaq 100 – QQQ) – including commissions and slippage of 0.03% per trade:
- No. of trades: 156
- Average unleveraged gain per trade: 1.2%
- Win ratio: 67%
- Profit factor: 2
- Annual returns (CAGR): 7.2% (assuming no leverage and including dividends)
- Exposure/time in the market: 10%
- Risk-adjusted return: 75% (CAGR divided by time spent in the market (0.1))
- Max. drawdown: -23%
The equity curve (log scale):
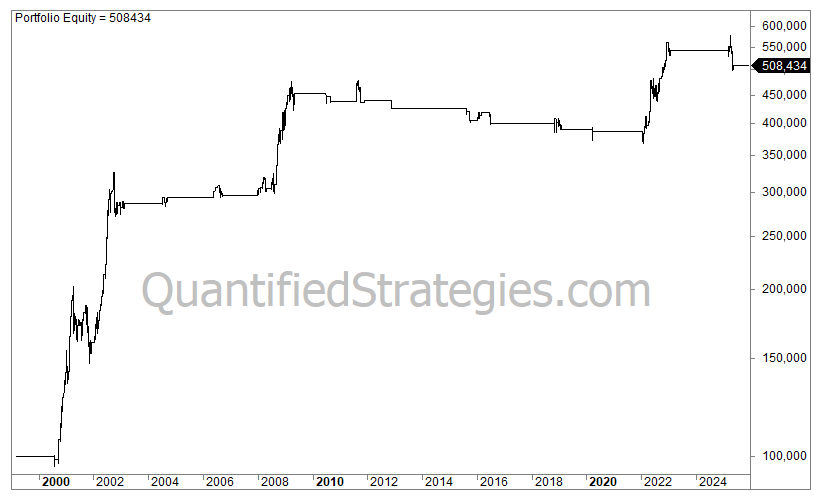
Order by clicking here (check for strategy no. 92):
Once you have paid you can download the strategy on this link.
Strategy 93: Short Trading Strategy In Bonds (TLT)
The strategy enters at the open and exits at the close, but not on the same day. There are three variables for entry and one for exit. This is a short strategy. We offer the strategy in Amibroker, Tradestation/Easy Language, and TradingView/Pinescript code.
This was our Monthly Trading Edge for August 2023 (for Gold Members).
Performance metrics (bonds – TLT) – including commissions and slippage of 0.03% per trade:
- No. of trades: 215
- Average unleveraged gain per trade: 0.3%
- Win ratio: 59%
- Profit factor: 1.7
- Annual returns (CAGR): 2.5% (assuming no leverage and including dividends)
- Exposure/time in the market: 12%
- Risk-adjusted return: 21% (CAGR divided by time spent in the market (0.12))
- Max. drawdown: -10%
The equity curve (log scale):
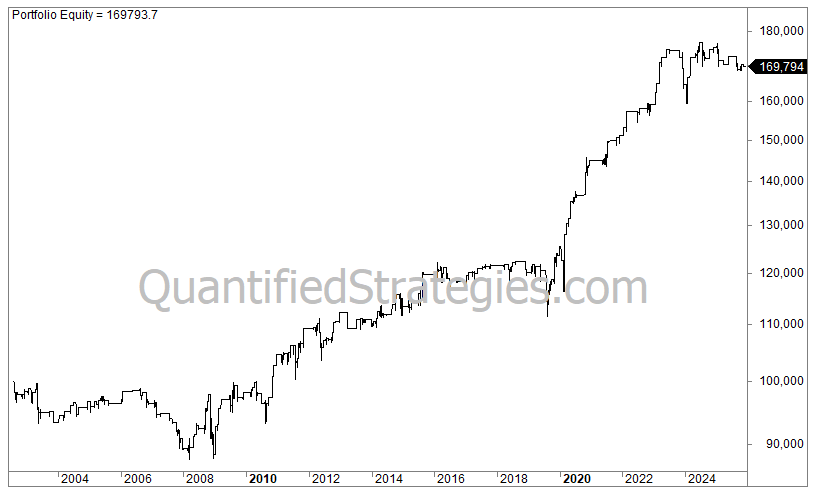
Order by clicking here (check for strategy no. 93):
Once you have paid you can download the strategy on this link.
Strategy 94: (Bundle 6) 3 NASDAQ 100 Trading Strategies (QQQ Bundle)
Please check our separate landing page for strategy bundles. Not eligible for any of the membership strategy selections. Published November 2024. Backtested on the ETF that tracks Nasdaq 100 (QQQ).
Strategy 95: 24-hour (Overnight) Strategy SPY/QQQ
The strategy enters at the close and exits at the close the day after, thus holding it for 24 hours (one trading day). There are two variables for entry. This is a long strategy. Backtested on the ETF that tracks S&P 500 (SPY).
This was our Monthy Trading Edge for October 2023 (for Gold and Platinum Members).
Performance metrics (SPY) – including commissions and slippage of 0.03% per trade:
- No. of trades: 405
- Average unleveraged gain per trade: 0.4%
- Win ratio: 63%
- Profit factor: 2.2
- Annual returns (CAGR): 5.1% (assuming no leverage and including dividends)
- Exposure/time in the market: 5%
- Risk-adjusted return: 102% (CAGR divided by time spent in the market (0.05))
- Max. drawdown: -7% (significantly less for SPY)
The equity curve (log scale):

Order by clicking here (check for strategy no. 95):
Once you have paid you can download the strategy on this link.
Strategy 96: Seasonal Strategy For Bitcoin
The strategy is based on a day-of-the-week pattern. There is more info about this strategy on our website.
Performance metrics (BTC-USD)
- No. of trades: 103
- Average unleveraged gain per trade: 2.7%
- Win ratio: 60%
- Profit factor: 2.3
- Annual returns (CAGR): 28%
- Exposure/time in the market: 10%
- Risk-adjusted return: 280% (CAGR divided by time spent in the market (0.1))
- Max. drawdown: -20%
The equity curve (log scale):
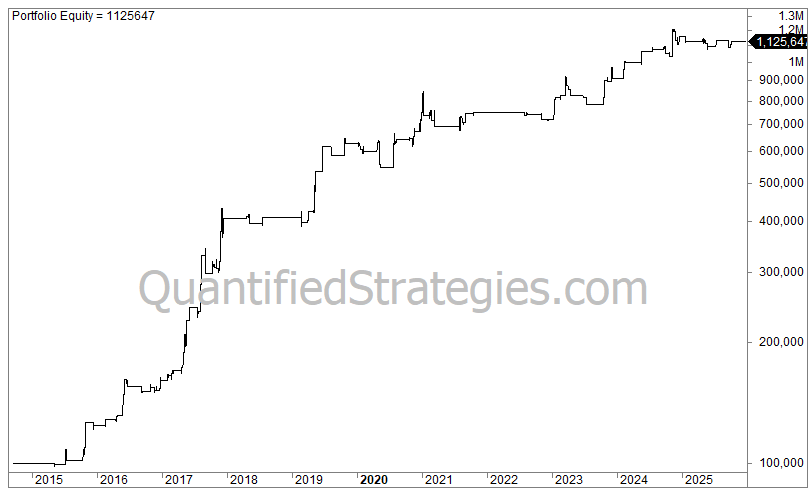
Order by clicking here (check for strategy no. 96):
Once you have paid you can download the strategy on this link.
Strategy 97: Long Pullback Strategy for Gold (GLD)
This is a long-swing strategy for gold (GLD); it also works for the main stock indices such as SPY and QQQ.
The strategy buys and sells at the close.
This strategy was our monthly trading edge for February 2025.
Performance metrics (GLD) – including commissions and slippage of 0.03% per trade:
- No. of trades: 90
- Average unleveraged gain per trade: 0.75%
- Win ratio: 73%
- Profit factor: 2.5
- Annual returns (CAGR): 3.3% (assuming no leverage and including dividends)
- Exposure/time in the market: 5%
- Risk-adjusted return: 58% (CAGR divided by time spent in the market (0.05))
- Max. drawdown: -8%
The equity curve (log scale):
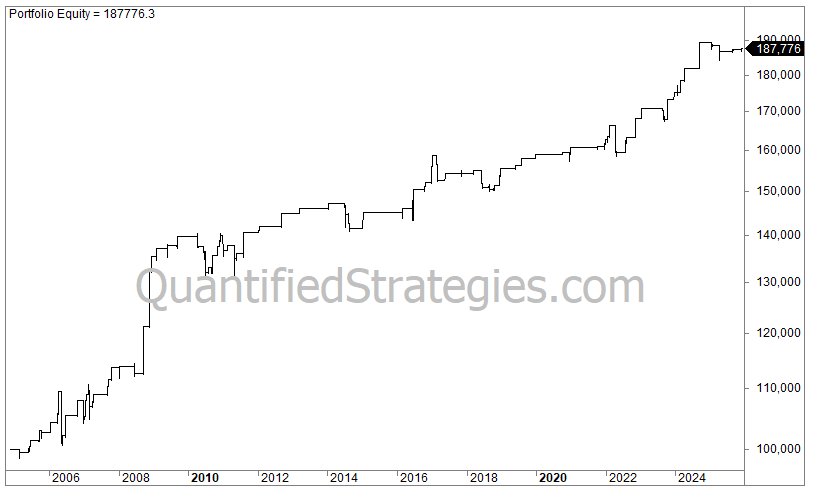
Order by clicking here (check for strategy no. 97):
Once you have paid you can download the strategy on this link.
Strategy 98: Long Bear Market Strategy for S&P 500 (SPY)
This is a long strategy but only trades in bear markets. Backtested on the ETF that tracks S&P 500 (SPY).
This was our Monthly Trading Edge for March 2025 (for Gold and Platinum Members).
Performance metrics (SPY) – including commissions and slippage of 0.03% per trade:
- No. of trades: 197
- Average unleveraged gain per trade: 0.6%
- Win ratio: 73%
- Profit factor: 2
- Annual returns (CAGR): 3.6% (assuming no leverage and including dividends)
- Exposure/time in the market: 4%
- Risk-adjusted return: 84% (CAGR divided by time spent in the market (0.04))
- Max. drawdown: -16%
The equity curve (log scale):
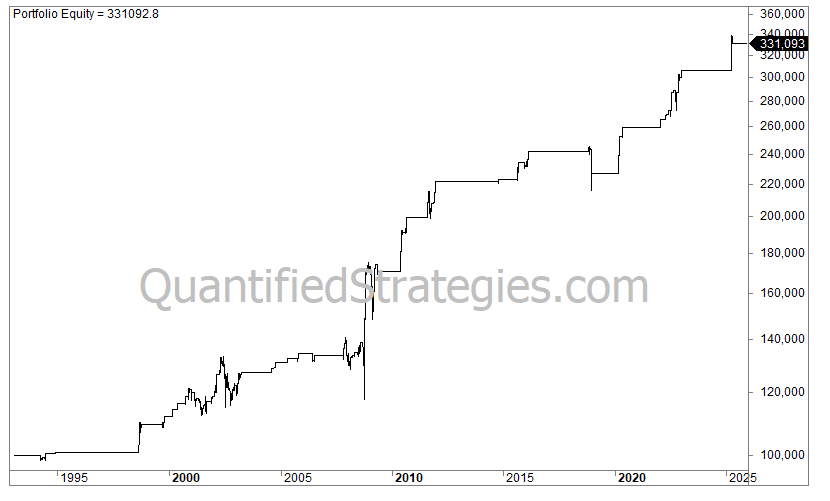
Order by clicking here (check for strategy no. 98):
Once you have paid, you can download the strategy on this link.
Strategy 99: Short Strategy for S&P 500 (SPY)
This is a short strategy. It has been most consistent for S&P 500, but also performed well for QQQ and SMH.
The strategy buys and sells at the close.
This strategy was our monthly trading edge for January 2025.
Performance metrics (SPY) – including commissions and slippage of 0.03% per trade:
- No. of trades: 147
- Average unleveraged gain per trade: 0.75%
- Win ratio: 69%
- Profit factor: 2.1
- Annual returns (CAGR): 3.3% (assuming no leverage and including dividends)
- Exposure/time in the market: 7.5%
- Risk-adjusted return: 45% (CAGR divided by time spent in the market (0.033))
- Max. drawdown: -11% (significantly less for SPY)
The equity curve (log scale) for long and short:
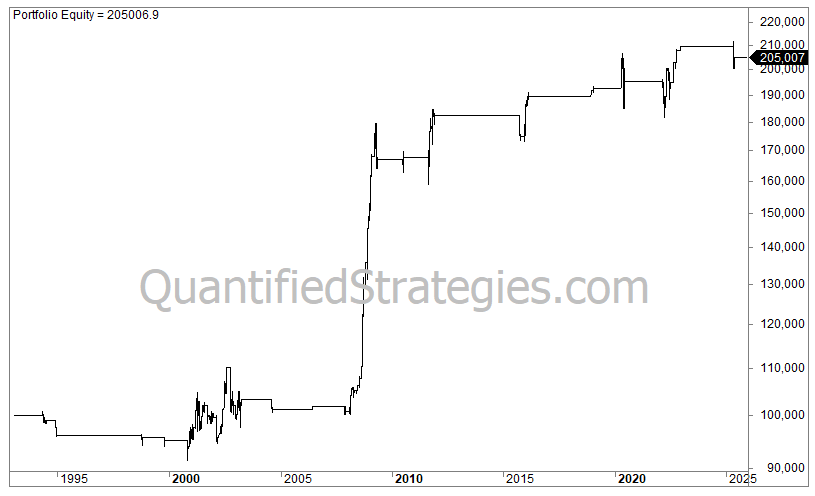
Order by clicking here (check for strategy no. 99):
Once you have paid you can download the strategy on this link.
Strategy 100: Long Gold Strategy (GLD)
This is a long strategy for gold (GLD).
The strategy buys and sells at the close.
This strategy was our monthly trading edge for May 2025.
Performance metrics (GLD) – including commissions and slippage of 0.03% per trade:
- No. of trades: 214
- Average unleveraged gain per trade: 0.45%
- Win ratio: 58%
- Profit factor: 1.6
- Annual returns (CAGR): 4.5% (assuming no leverage and including dividends)
- Exposure/time in the market: 21%
- Risk-adjusted return: 22% (CAGR divided by time spent in the market (0.21))
- Max. drawdown: -15%
The equity curve (log scale) for long and short:
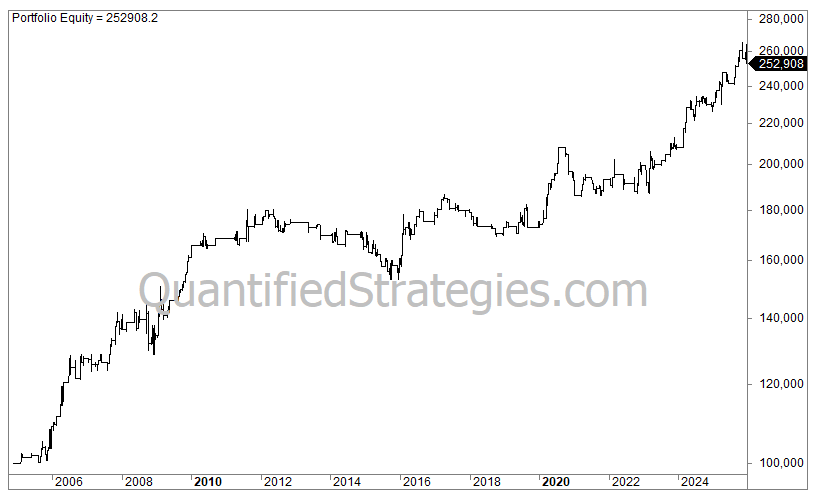
Order by clicking here (check for strategy no. 100):
Once you have paid you can download the strategy on this link.
You can purchase backtested strategies individually (one by one), as strategy bundles, or via our memberships:
- Become a member!
- Buy 1 Strategy (Without Becoming a Member) Pick 1 strategy from the strategy list or buy directly here.
- Buy 20 Strategies – Gold member: Pick 10 strategies from the strategy list, and you will also get an additional 10 strategies over the next 12 months (20 in total). Access to Amibroker and Tradestation code and access to gated trading rules for hundreds of strategies.
- Buy Bundles!
- Buy 34 Strategies (Incl Bundles) – Platinum member: Pick 15 strategies from the strategy list, and you will also get an additional 10 strategies over the next 12 months. Access to Amibroker and Tradestation code, access to gated trading rules for hundreds of strategies, 3 bundles of your choice (#33 – #36, #43, #68, or #75 from our strategy list), backtesting course, and trading course. Recurring annually at a 50% reduced price (needs to be canceled by the subscriber).
- Futures Systems (Backtested): We have a separate list of trading strategies for futures.
Each strategy comes with trading rules in plain English and a strategy code of your choice (so you can backtest yourself – to trade live, you might need to change the code). Available right now are Amibroker, Tradestation, and plain English – unless stated (Tradingview where indicated). It is important to note that while every effort has been made to ensure the accuracy of the information provided, we cannot guarantee that the results obtained using this trading strategy will be replicated.
We do investment research and analysis based on statistics and history for informational and educational purposes. This is factual information without opinions. It is not personalized investment advice.
Summary from our shop of Trading Strategy Metrics
Key Insights from Metrics
• Highest CAGR: The Seasonal Strategy For Bitcoin (Strategy 96) reported the highest Compound Annual Growth Rate (CAGR) at 28%, followed by the combination of long and short strategies (Strategy 47) at 19%.
• Highest Risk-Adjusted Return: The Day Trading Strategy (Short) For S&P 500 (Strategy 73) had the highest calculated Risk-Adjusted Return at 671%. The Overnight Strategy for Gasoline (UGA) (Strategy 86) also showed a high return at 177%. These high figures correlate with very low market exposure (2% or 2.5% in those cases).
• Maximum Profit Factor: The Triple RSI Trading Strategy (Strategy 59) reported the highest Profit Factor at 8, closely followed by the Momentum Trading Strategy (Strategy 52) at 7.
• Highest Win Ratio: The Coppock Trading Strategy (Strategy 57) had a 100% Win Ratio, though based on only 13 trades. The Triple RSI Trading Strategy (Strategy 59) reported a 90% Win Ratio.
• Lowest Drawdown: The Overnight Strategy for Russell 2000 (Strategy 85) and the Long Panic Strategy For Bonds (Strategy 74) had the lowest maximum drawdowns, reporting -2% and -2.7%, respectively.
• High Risk/High Reward Bundles: The combined Bitcoin Trading Strategy (Strategy 48) offered a 100% CAGR but incurred the deepest maximum drawdown at -49% (!!!). Strategy 90 (Combined Trend Following + Mean Reversion on QQQ) also showed a significant drawdown of -50%.
Disclaimer (trading strategies for sale)
Quantified Strategies (SIA Lofjord) is not an investment advisor. The content and information provided are educational and should not be treated as financial advisory services or investment advice. Trading and investment in securities involve substantial risk of loss and is not recommended for anyone that is not a trained trader or investor – it shall be conducted at your own risk. It is recommended that you never risk more than you are willing to lose. Leverage can lead to substantial losses. Any use of leverage, margin, or shorting is at your discretion. Quantified Strategies (SIA Lofjord) is not responsible for any losses that occur as a result of its content and information. Always use a demo account for many months before you do live trading. Trading requires hard and systematic work – there is no easy money, and markets change all the time. And remember: always trade smaller position sizes than you’d like to.
We assume no responsibility or liability for your trading and investment results. The indicators, strategies, programming code, Trading Edges, columns, articles, and all other features of the website QuantifiedStrategies.com are provided for informational and educational purposes only and should not be construed as investment advice. We don’t provide investment advice.
Hypothetical or simulated performance results have certain limitations. Unlike an actual performance record, simulated results do not represent actual trading. Commissions and slippage are not included, and most trading signals are triggered at the close. Also, since the trades have not been executed, the results may have under or overcompensated for the impact, if any, of certain market factors, such as lack of liquidity. Simulated trading programs, in general, are also subject to the fact that they are designed with the benefit of hindsight. No representations are made that any account will or is likely to achieve profit or losses similar to those shown.